Welcome to Kadence Pulse, where we explore how hybrid work is unfolding through real-world data from the Kadence platform.
In this edition, we’re moving past averages to examine something more telling: the shape of office use across different business sectors. From consistency to chaos, and from bursty collaboration to habitual rhythms, the story isn’t just about how many people are coming in. It’s how and when they show up that reveals the real nature of hybrid work.
Let’s take a look.
Which Sectors Use The Office Most?
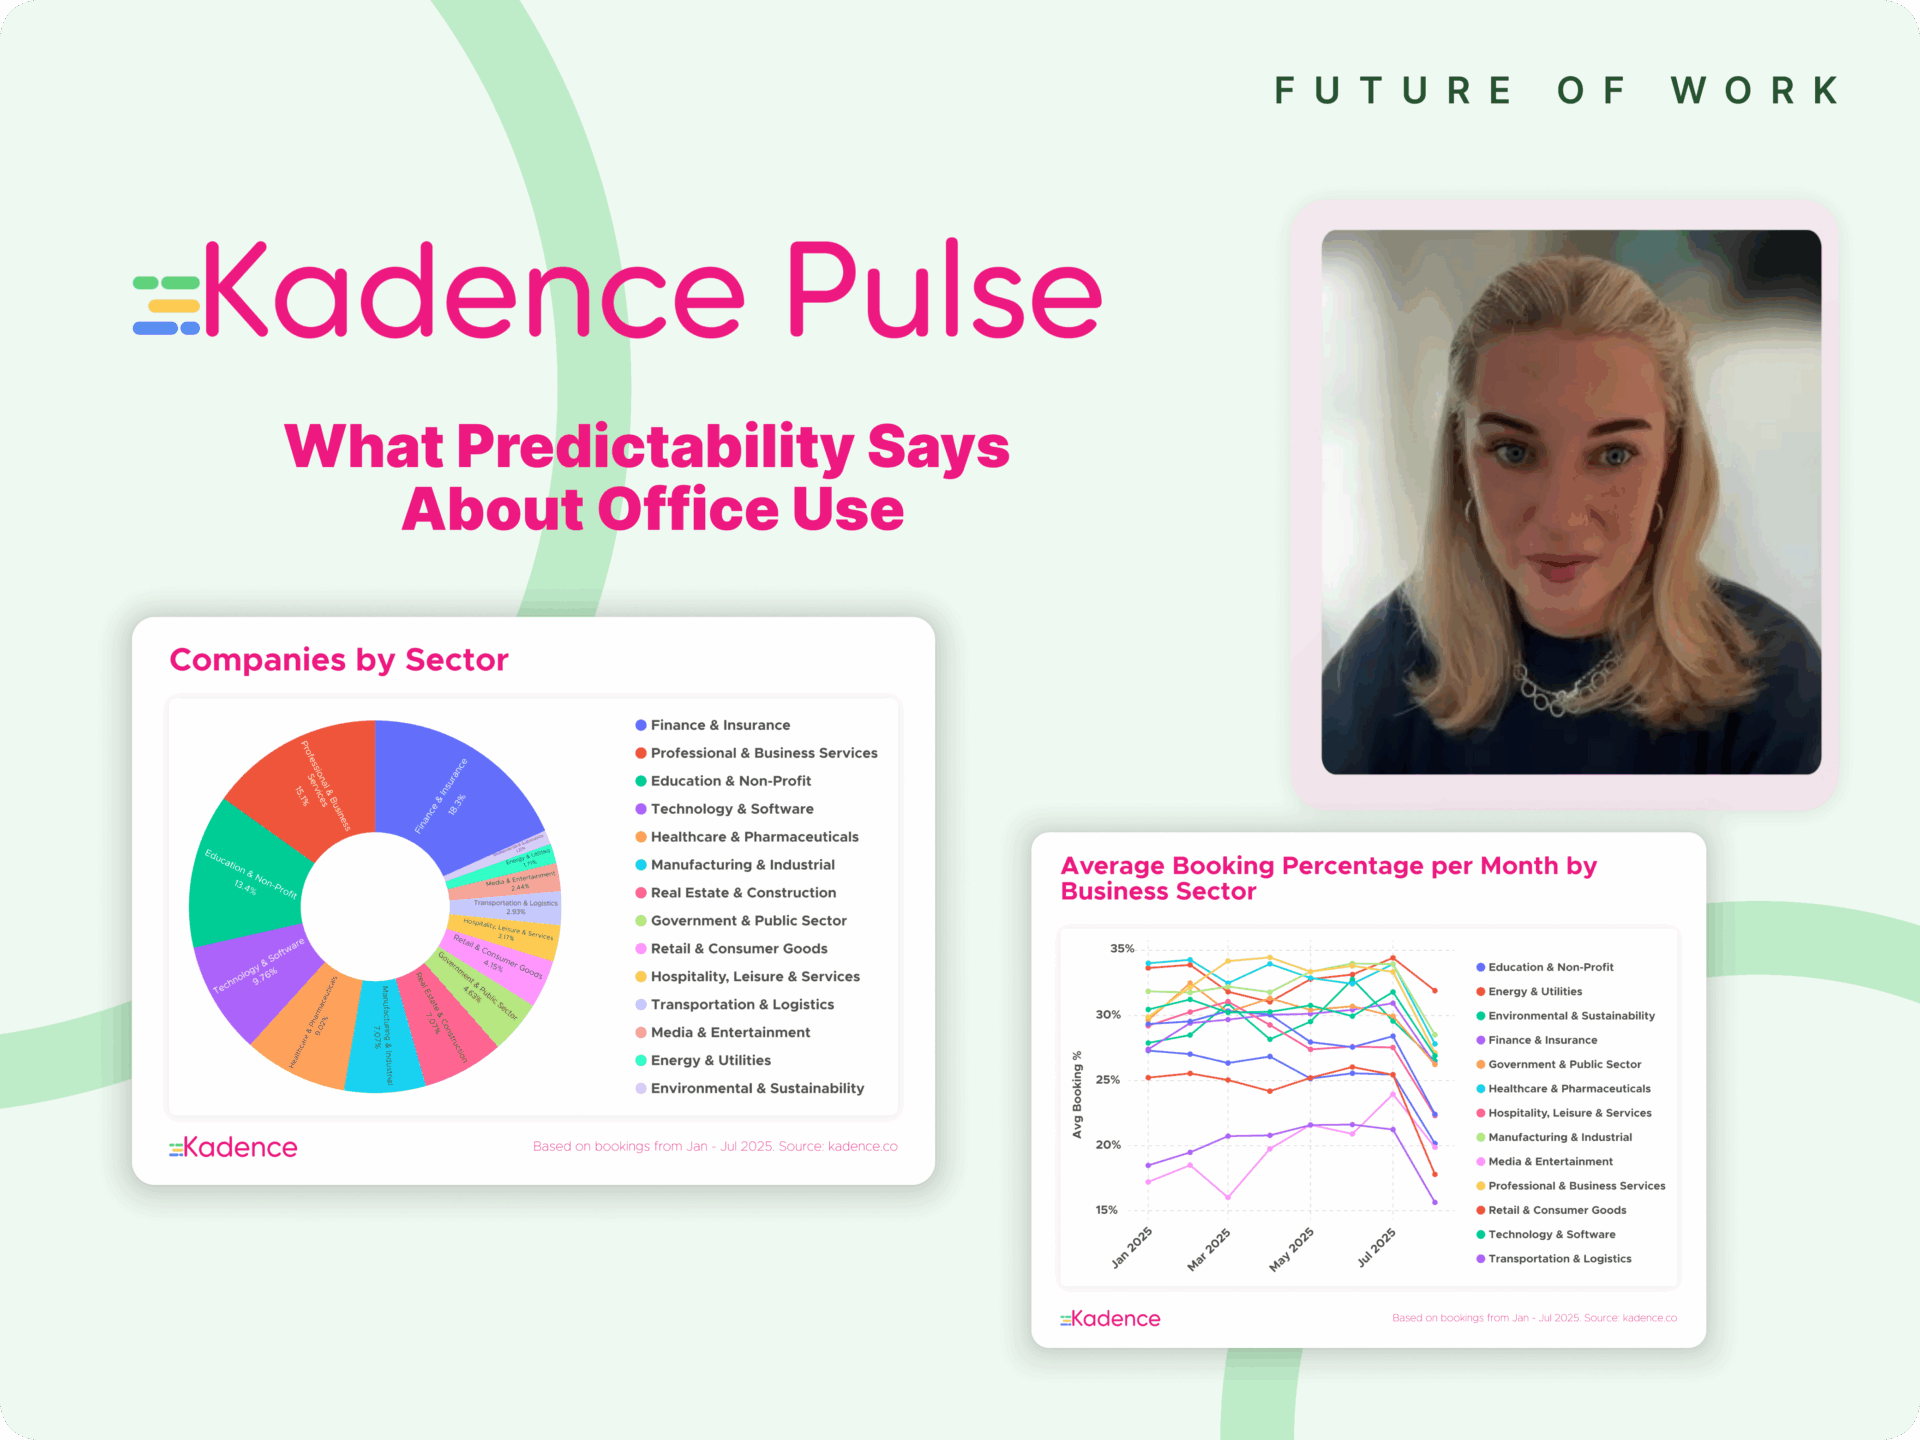
We started by tracking average utilization per month, industry by industry. But first, it’s helpful to understand the composition of our dataset.
The largest share of companies on Kadence come from finance and insurance, followed by professional and business services, and education and nonprofit sectors. While all sectors are represented, the size of each group helps contextualize the patterns we observe.
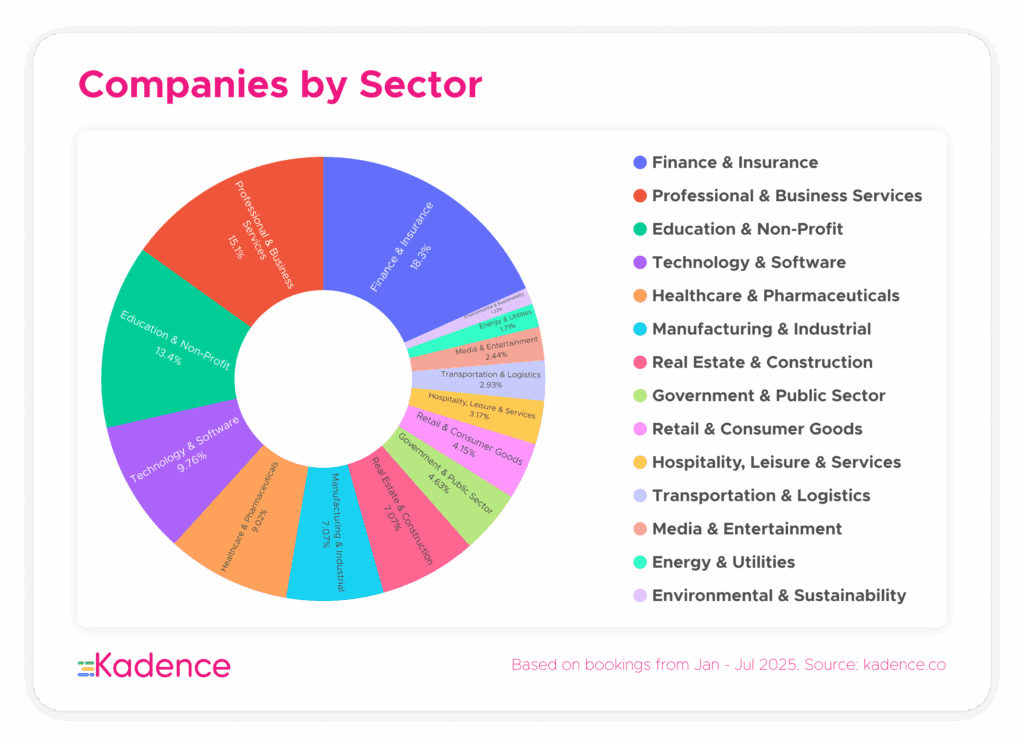
Note: The “unknown/other” category, which was the largest, has been removed to highlight named sectors more clearly.
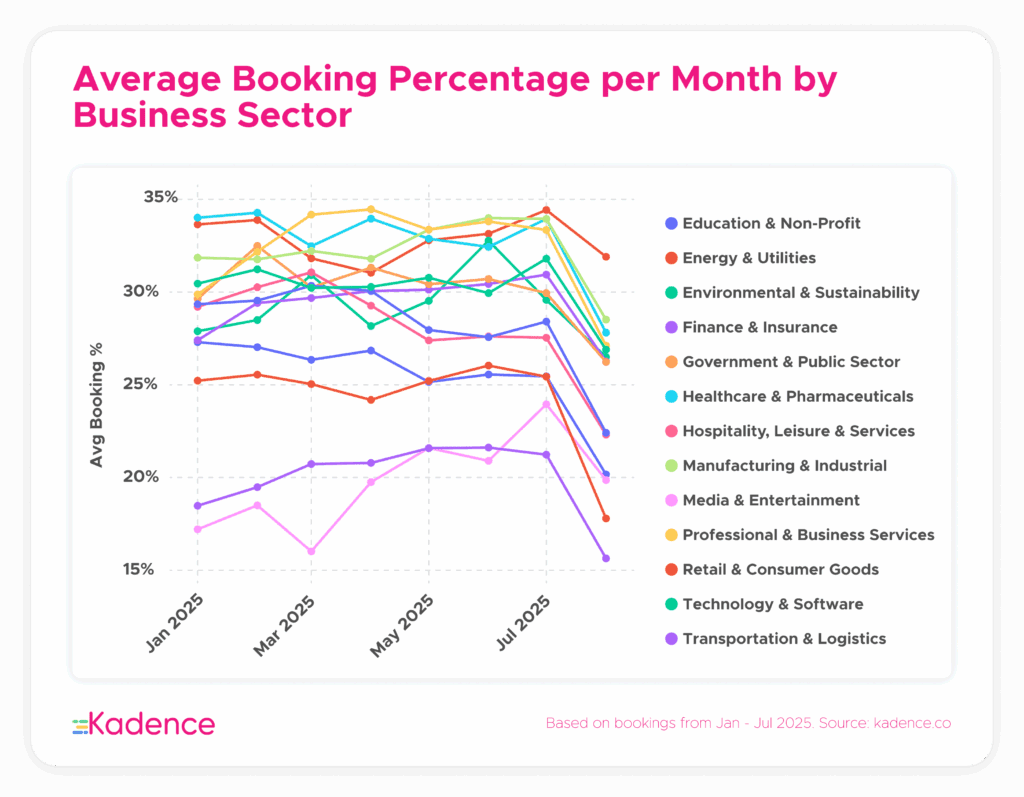
In January, healthcare and pharmaceuticals topped the list in average occupancy. They stayed consistently high through the first half of the year.
By midyear, professional and business services overtook them, climbing from sixth place in January to first by May and June. Manufacturing and industrial followed a similar path, gradually rising and nearly matching the leaders in June.
At the other end, media and entertainment stayed at the bottom, followed closely by transportation and logistics. These sectors may depend more on asynchronous or off-site workflows. Environmental and sustainability organizations showed the most fluctuation of any group.
When Do Teams Show Up?
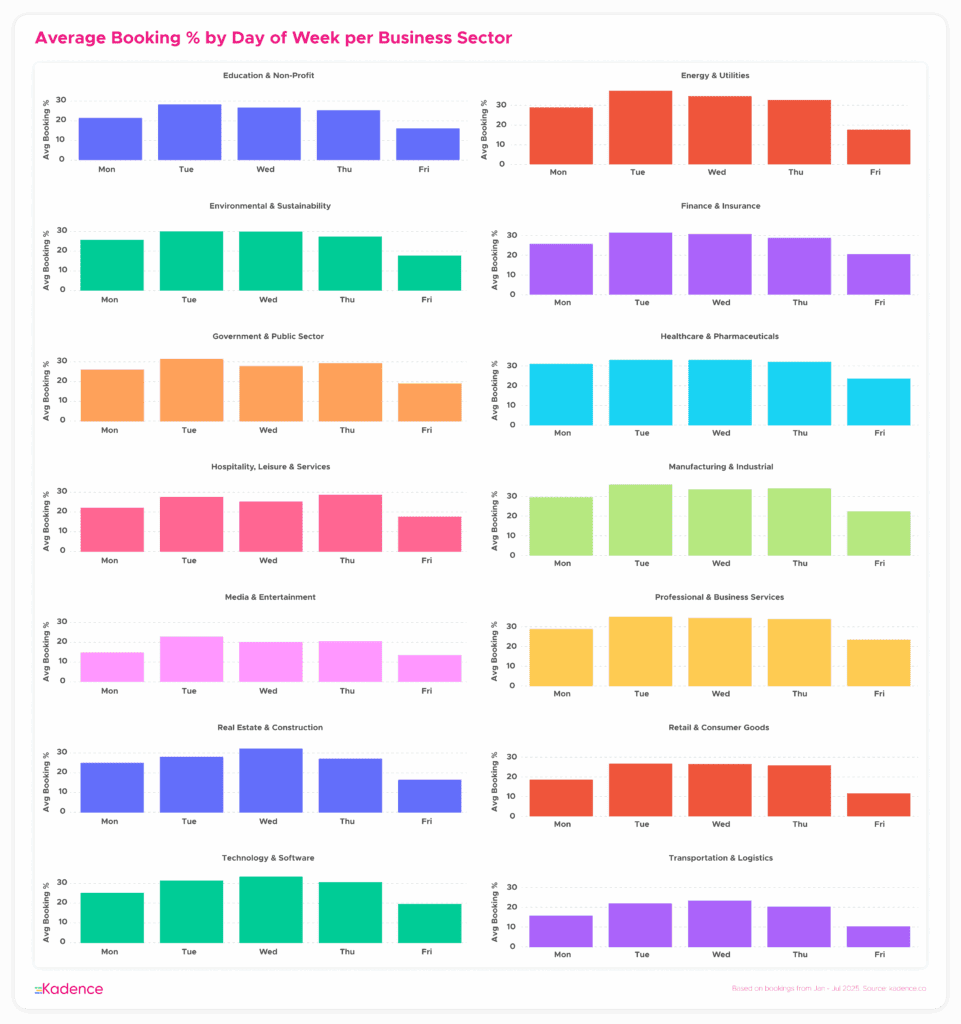
Across most sectors, Tuesday continues to anchor the office week. It is the peak day for finance and insurance, media and entertainment, education and nonprofits, government and public sector, and manufacturing.
Retail and consumer goods, professional services, and healthcare teams follow a more even rhythm, with attendance spread consistently across Tuesday through Thursday. Technology and real estate companies, in contrast, tend to peak on Wednesdays.
Only one sector stands apart. Healthcare maintains steady attendance throughout the full week. There is no clear drop on Mondays or Fridays, just quiet consistency from start to finish.
Who’s Predictable And Who’s Not?
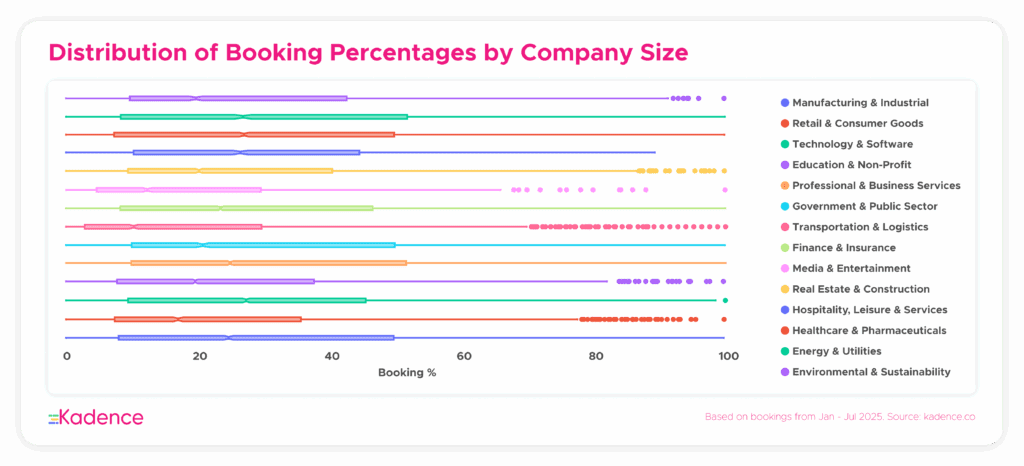
To better understand behavior, we looked beyond averages and examined the full distribution of office use across all days in 2025.
Every industry showed a left-skewed curve, meaning low-occupancy days were more common than high ones. But not all sectors followed the same pattern.
Media and entertainment had the narrowest spread, with usage levels that were low but consistent.
Environmental and sustainability organizations were at the other end of the spectrum, swinging dramatically between high and low attendance from week to week.
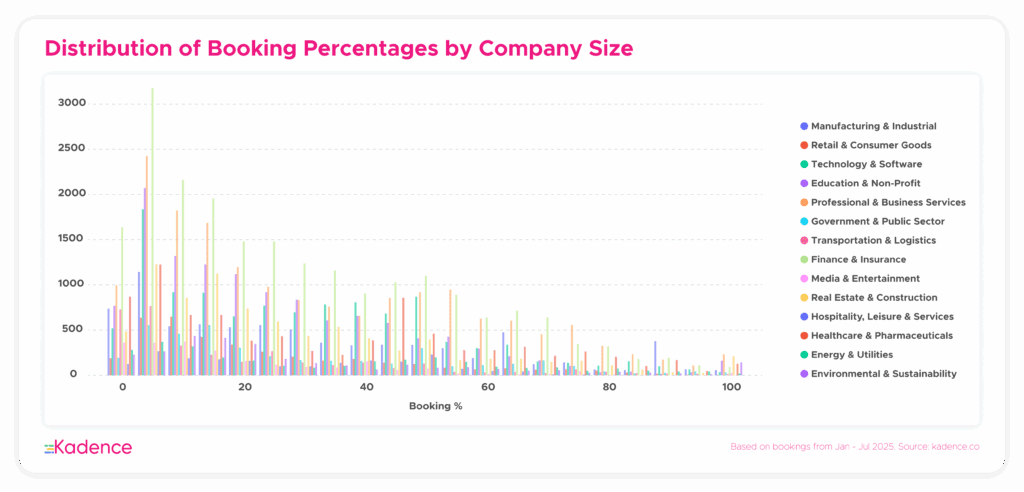
Professional and business services recorded the highest number of near-full office days, regularly hitting 97.5 to 100 percent utilization.
Manufacturing and industrial teams also stood out, with the most days landing in the 87.5 to 92.5 percent range.
Finance and insurance revealed a dual pattern. One group of users engaged at very low levels, between 2.5 and 7.5 percent. Another group showed more consistent engagement, clustering around 50 to 60 percent. This likely reflects a mix of fluid individual attendance and more structured team-driven office use.
These distributions reveal more than averages ever could. Predictable usage suggests strong coordination and clear intent. Wider, more uneven curves point to ad hoc, event-based patterns that may reflect bursts of collaboration or shifting operational needs.
Final Thoughts: The Real Office Metric Might Be Reliability
Hybrid success doesn’t come from just having people in the office. It comes from knowing when and how the office will be used.
Some sectors are making space a dependable part of the workweek. Others are treating it as an occasional tool. Both approaches can work, but they require different operational strategies.
What stands out in this dataset is how rhythm is starting to settle within certain industries. Professional and business services, for example, are showing not just higher utilization but repeated full-capacity booking days. These aren’t scattered spikes. They point to deliberate, coordinated use of the office. That kind of pattern suggests teams are aligning their in-office time around shared goals.

Another insight is the emergence of dual patterns within a single sector. In finance and insurance, we see a large group using the office only occasionally, and another engaging more consistently. This suggests that flexible work is not a single mode, but a layered set of behaviors. Organizations that recognize and support both will likely benefit from stronger engagement and more efficient use of space.
Healthcare continues to lead in consistency. Unlike most sectors, healthcare teams maintain steady attendance across all five weekdays. This kind of even distribution gives them a practical advantage in planning and collaboration. It could also serve as a model for sectors that need stability but are still trying to find it.
Perhaps the most important takeaway is this: high utilization isn’t necessarily the goal. Predictable and purposeful usage matters more. If your space is full on Wednesdays and quiet the rest of the week, or if different teams are using the office in entirely different ways, that’s not a failure. It’s information. It gives you a baseline to adjust your strategy around the reality of how your people work.
Want to understand how your teams are using space, and whether it matches the rhythm of your work? Book a demo with our hybrid experts and see how Kadence can help you turn workplace patterns into workplace intelligence.


