
Workplace analytics
Workplace analytics that drive performance.
Know which spaces people use before deciding what to keep or change. Kadence workplace analytics connects bookings, attendance, and utilization so workplace leaders can bring evidence to portfolio and policy decisions.
Illustrative workplace analytics for the Sales team. A report shows weekly check-ins and an occupancy heatmap, with Sales at 81% booked, 74% checked in and 98% booked on the peak day. The view then slides across to a floor plan of booked against used desks: 27 desks booked and used, 8 booked but not used (ghost bookings, space that could be freed for others) and 1 not booked.
Book desks and rooms from Claude, ChatGPT or Copilot with the Kadence MCP server (early access).
What you can measure
Workplace analytics software for every office
Kadence workplace analytics turns bookings and check-ins into reports on how your offices are used. Workplace Insights, in every WorkOps plan, shows attendance, occupancy, no-shows, heatmaps and average weekly hours by building, floor and team. Insights Plus adds custom dashboards and policy compliance reporting for leadership.
Reports are only as good as the data behind them. See how Kadence Sense captures occupancy from check-ins rather than bookings alone.
- Attendance
- How many people came in, by day, team and location, counted from check-ins.
- Occupancy rate
- The share of desks, rooms or floor space in use, at a point in time or on average.
- No-shows
- Bookings that nobody checked in to. They make space look busier than it is.
- Peak days
- The busiest days in a normal week, which set the capacity you really need.
- Heatmaps
- Floor plans colored by how often each desk, room or zone is used.
- Average weekly hours
- How long people spend in the office each week, on average.
- Policy compliance
- Whether teams meet your in-office goal over time, reported in Insights Plus.
Space Utilization
Optimize Your Real Estate Footprint
Bring evidence to your next lease decision. See where space is underused and how office demand changes across locations. Identify underused areas, justify lease renewals, and assess the cost of office space per employee—all while planning for future hybrid policy changes.
- Occupancy Trends – Track occupancy patterns, check-in rates vs. bookings, and underused areas across offices.
- Peak Office Trends – Monitor peak days, prevent overcrowding, and optimize workspace allocation.
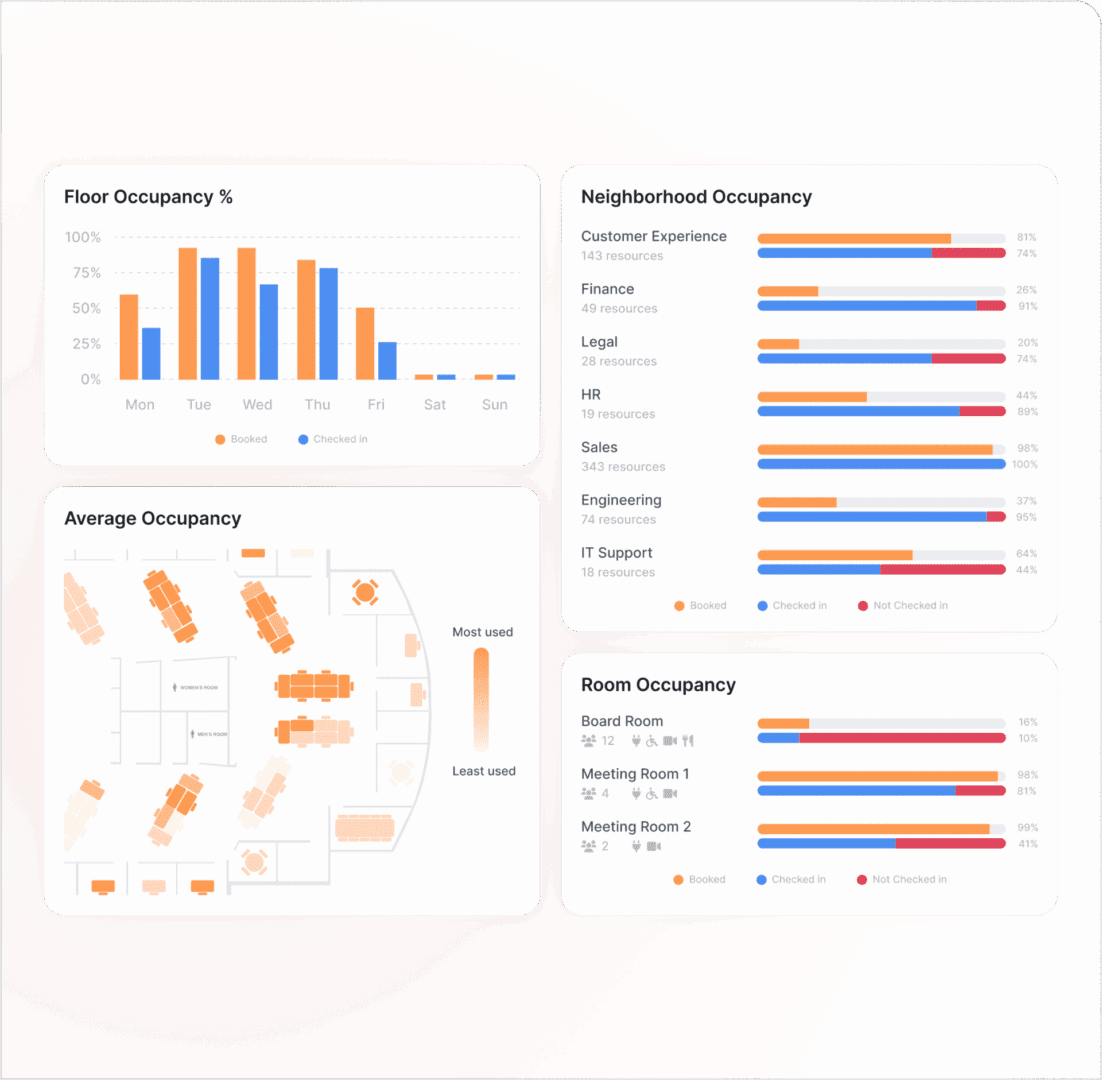
Occupancy Insights
Measure Hybrid Policy Compliance
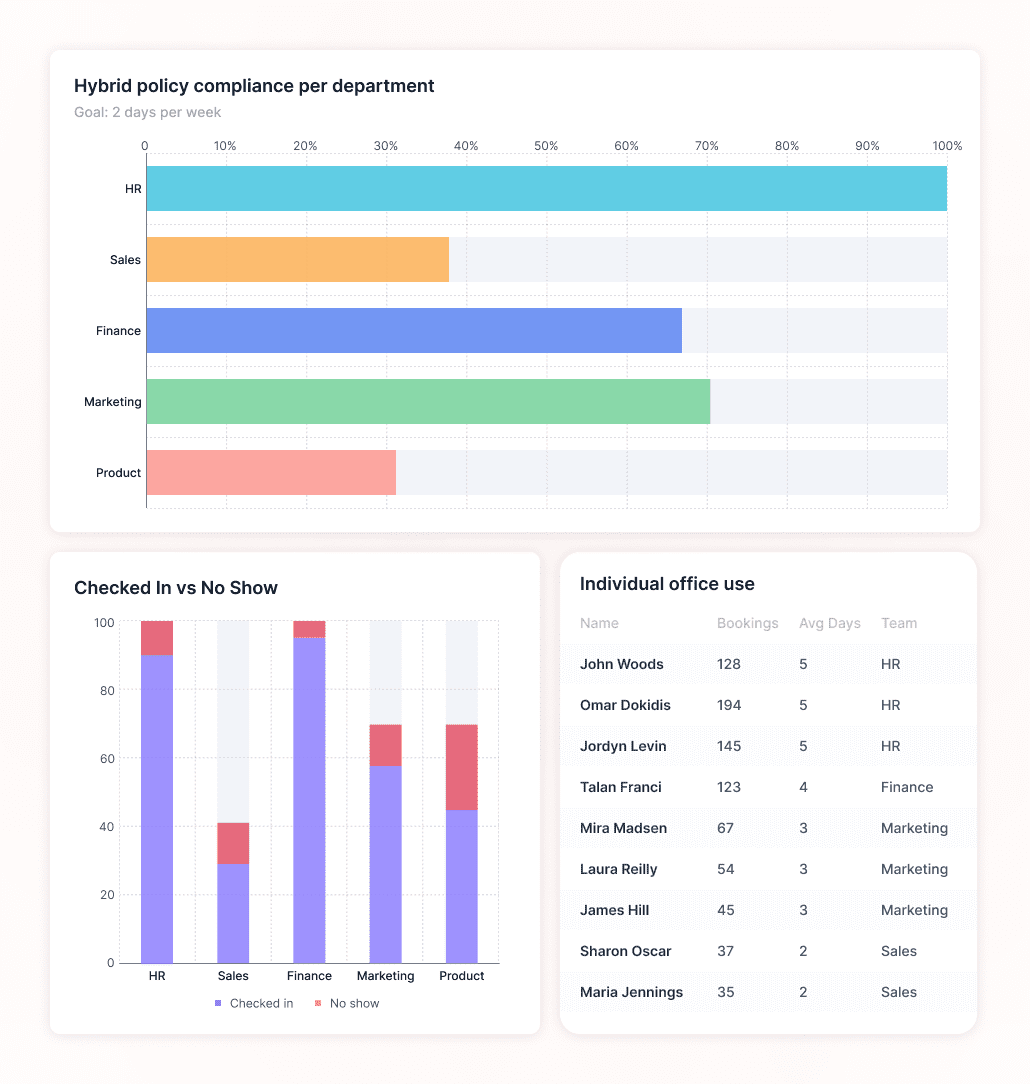
See whether workplace policy matches how teams come in. Compare attendance by team, department, and location before deciding what needs to change.
- Team Attendance – Compare in-office attendance across teams, and track actual attendance vs. expected presence.
- Hybrid Preferences – Identify preferred in-office days by department and region.
Collaboration Trends
Analyze Collaboration Patterns
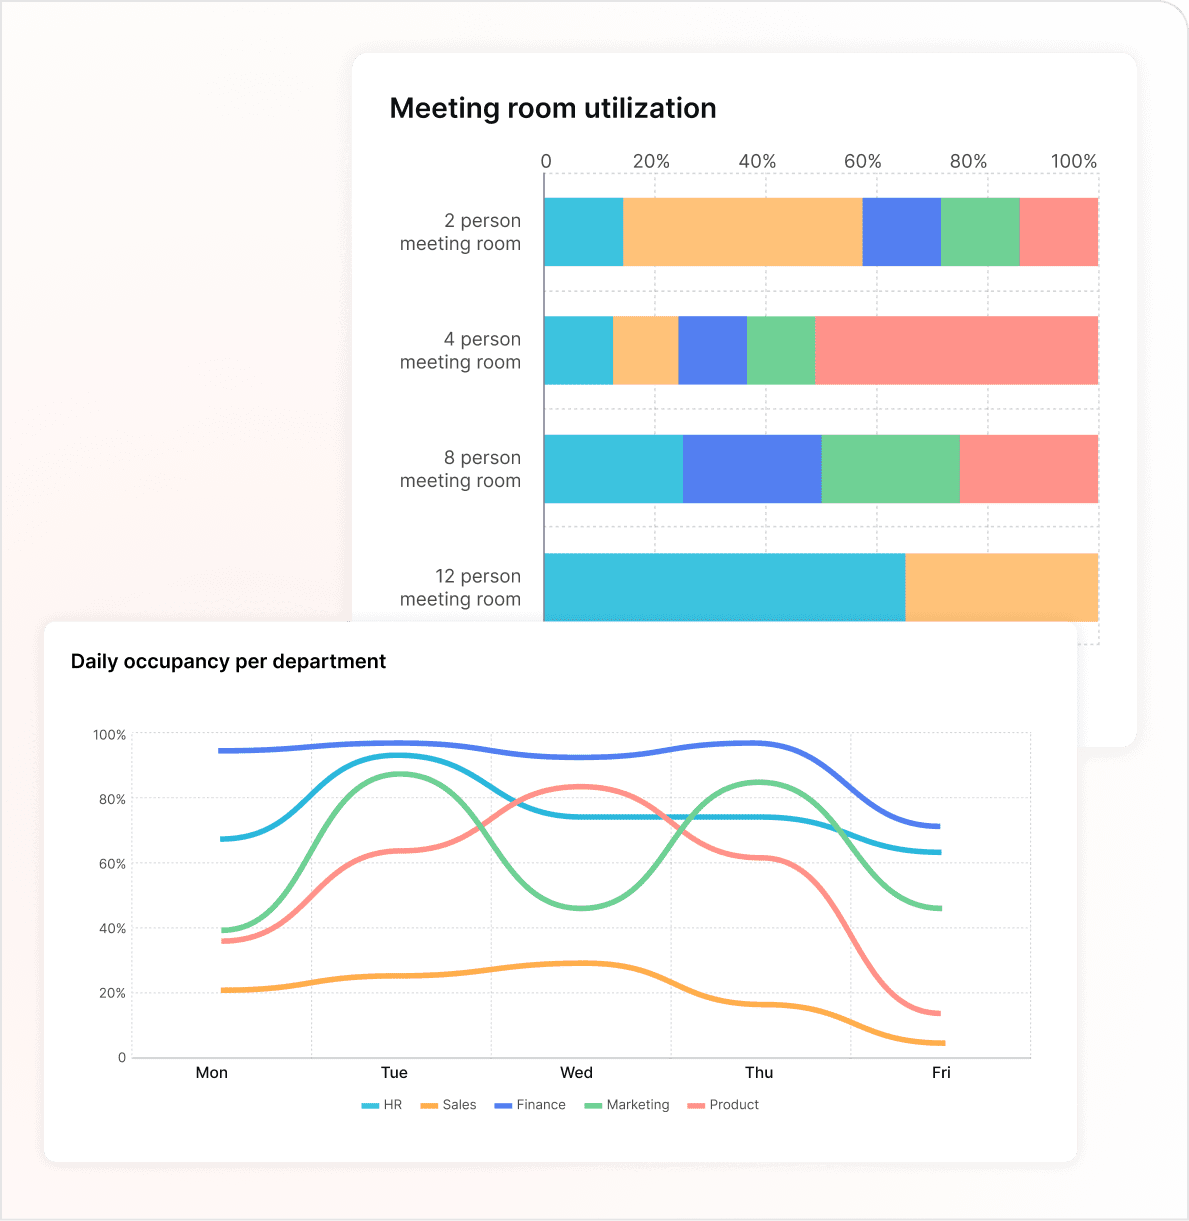
Plan team days around how people work together. Use booking and on-site collaboration patterns to inform when teams come in. Make informed decisions to foster better in-person collaboration and smarter team day scheduling.
- Meeting Frequency – Track booking overlaps and meeting frequencies.
- In-Office Engagement Trends – Identify which departments collaborate most on-site.
Insights Plus
Brings Your Data To Life Through Custom Reporting
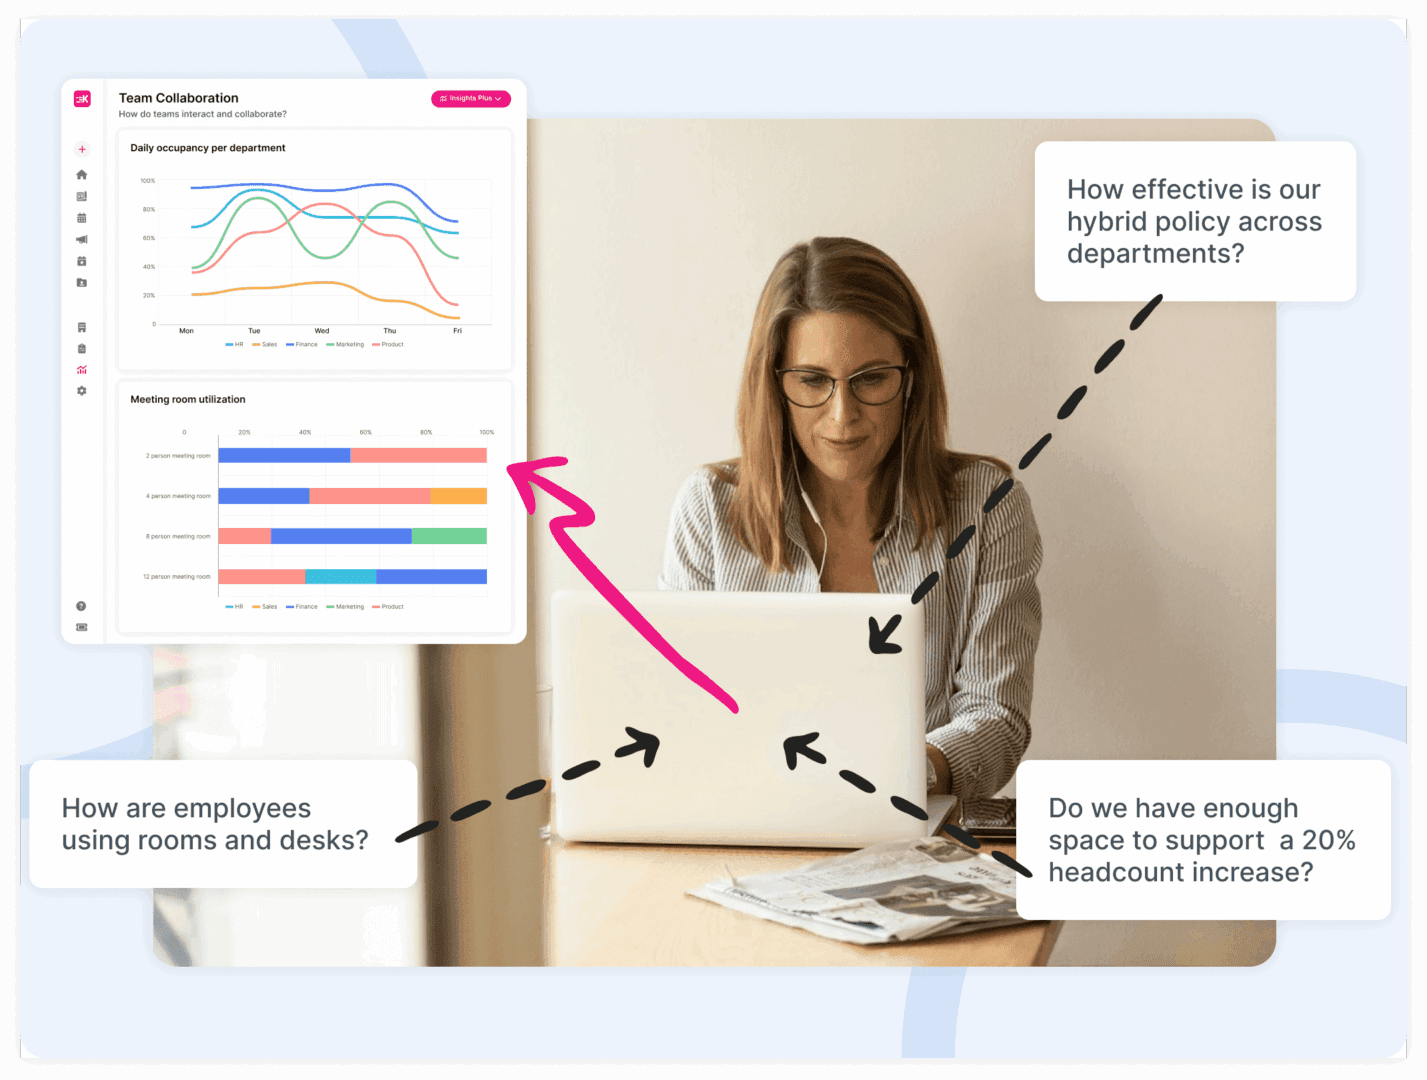
Spend less time piecing together reports across locations. Insights Plus brings workplace data into one view for the decisions your organization needs to make. Insights Plus consolidates all data into a single, comprehensive view across all locations—delivering workplace analytics that serve as your one source of truth for decision making. No guesswork—just clear, actionable insights. With support from our hybrid experts team, you can create custom analytics that align with your unique goals.
Executive reporting
Reports leaders can act on
Executive dashboards
Insights Plus custom dashboards bring every location into one view for leadership and portfolio reviews.
Policy compliance
Track attendance against your in-office goal by department, week by week, with Insights Plus.
Exports with audit detail
Export attendance and booking data as CSV. Booking exports show who created each booking and who checked in.
API and webhooks
Pull workplace data into your own reporting tools with the public REST API, or send real-time events with outbound webhooks.
Interactive Floor Plans. Forecast office usage and space utilization ahead of time
Data Export. Prioritize real estate spend by reporting on space management utilization
Customized Seating. Create, edit, and manage Office Neighborhoods and Assigned Desks
Dedicated Customer Support. Our All-star Customer Experience team is always around to help
Give Instant Feedback. Give direct feedback to Kadence on improvements in the app
Auto-Release. Automatically free up ‘No-Show’ bookings back into the system to reduce wasted space
Guest And Onsite Booking. Invite guests and get notified of their arrival
Capacity Limits. Set the occupancy limit for each floor on any day
FAQ
Frequently asked questions
What is workplace analytics software?
Workplace analytics software turns bookings, check-ins and attendance data into reports on how offices are used. Workplace and real estate teams use it to see which spaces are busy or empty, whether attendance policies work and how much space they really need. Every WorkOps plan includes Workplace Insights, and Insights Plus adds custom dashboards.
What can I measure with Kadence workplace analytics?
Workplace Insights shows attendance, occupancy, no-shows, heatmaps and average weekly hours by building, floor and team. You choose whether lockers and parking count toward attendance. Insights Plus adds custom dashboards, including policy compliance reporting, and you can export the data as CSV for your own analysis.
What is space utilization software?
Space utilization software measures how much of your office capacity people actually use over time, not just how much is booked. Kadence measures use from check-ins, including automatic check-ins through the Kadence Agent, so empty bookings do not inflate the numbers. Heatmaps and peak-day views show where space sits idle and where it runs short.
How is workplace analytics different from occupancy tracking?
Occupancy tracking captures the data: who came in, when and where. Workplace analytics is what you do with that data: trends, comparisons and reports that support decisions. In Kadence, Kadence Sense captures presence through the Kadence Agent, network detection, badge data and kiosks, and Workplace Insights and Insights Plus turn it into reports.
Can I build executive and policy compliance reports?
Yes. Insights Plus lets you build custom dashboards that bring every location into one view for leadership reviews. It includes policy compliance reporting, so you can track attendance against your in-office goal by department over time. Insights Plus is included in WorkOps Pro and is also available as an add-on.
Can I export Kadence data or connect it to BI tools?
Yes. Export attendance and booking data as CSV, including who created each booking and who checked in. To feed your own reporting tools or data pipelines, use the Kadence public REST API with API keys. Outbound webhooks send real-time events to other systems as they happen.
How does Kadence handle ghost bookings in its reports?
A ghost booking is a desk or room that is booked but never used. Kadence reports no-shows separately, and auto-release frees unused bookings so other people can take the space. Because check-ins can come from the Kadence Agent, kiosks, room displays and badge data, reports reflect who actually turned up.
Explore more
Next step
Start Working Smarter With Kadence
Book a demo, and see Kadence in action. Find out how we can help create smarter, more productive workplace for your people.