
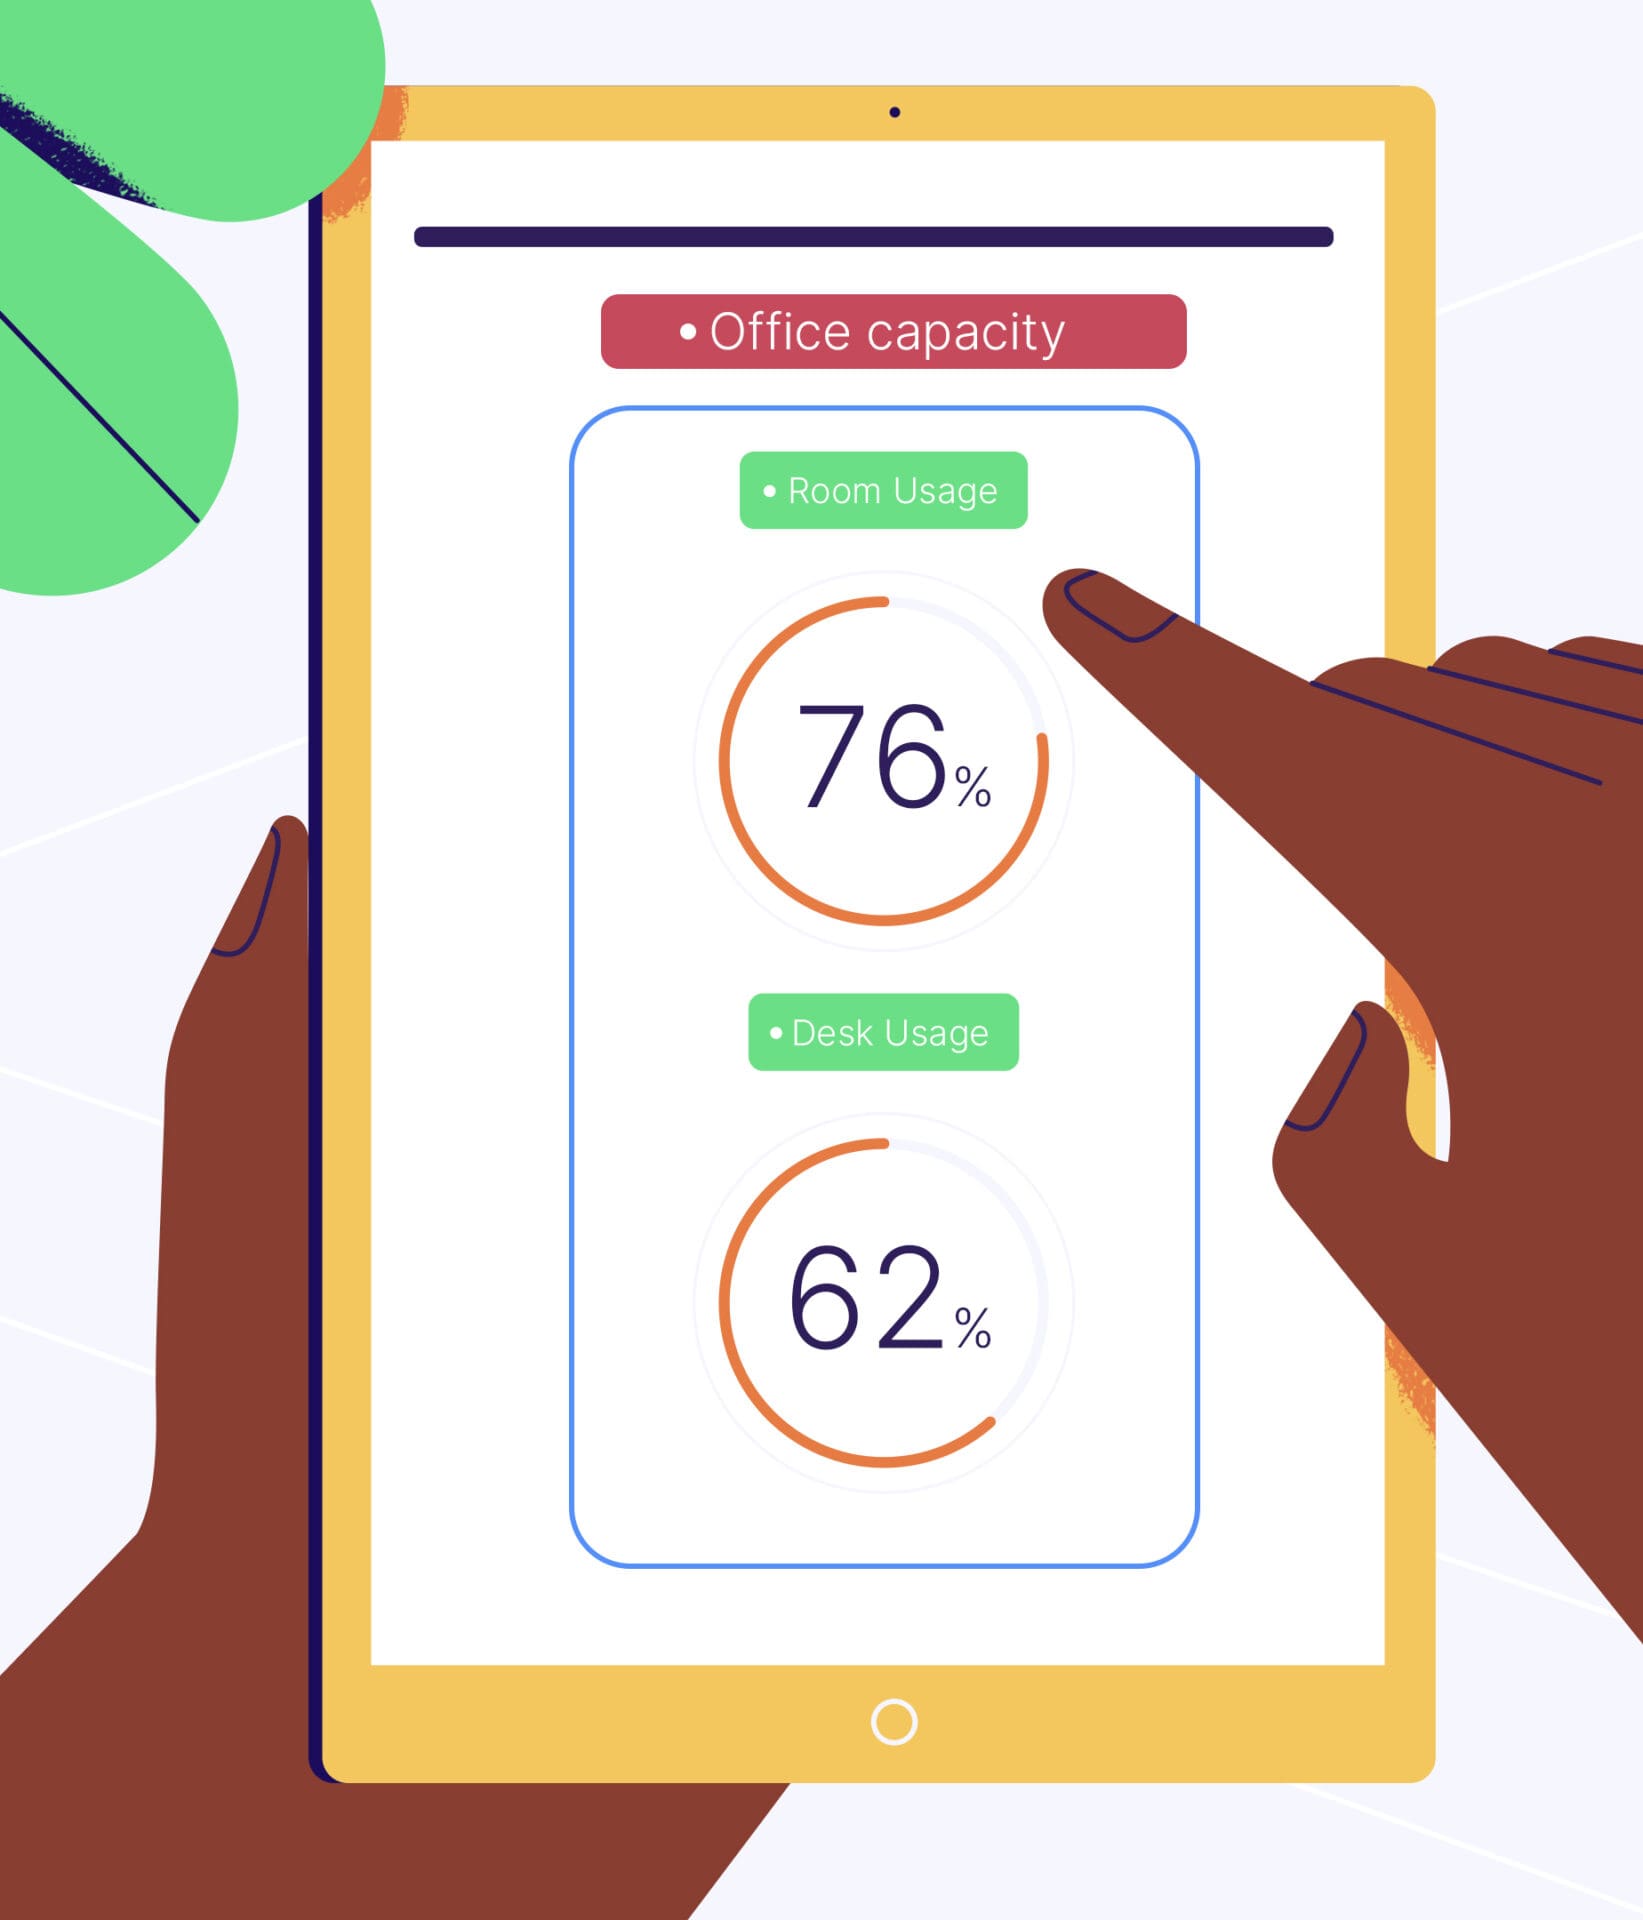
Desk utilization is how often, and for how long, the desks in an office are actually used compared with the desks that are available. It is the most practical way to measure space utilization in a hybrid office, because desk-level data shows which desks people use, when and for how long.
Measuring desk utilization answers the questions every workplace team faces when attendance varies from day to day. Which seating layouts work? Do you have the right number of desks? Which floors or neighborhoods are overcrowded, and which sit empty? For current benchmarks and a full planning method, see the office space planning guide.
What is desk utilization?
Desk utilization is the share of available desk time that people actually use over a given period. It is measured at the level of the individual desk, so it shows how often each desk gets used, for how long and by whom. That makes it more precise than a building headcount, which only tells you how many people were present.
In a hybrid office, people book time in the office for a specific purpose, and occupancy fluctuates across the week. Desk utilization data lets a workplace team be proactive instead of reactive: it shows patterns across days, weeks and months, so you can plan space around how people really work.
What is a space utilization rate?
A space utilization rate is the proportion of a space’s capacity that is actually used over time. For desks, it compares the desks in use, or the desk hours in use, with the total available in the same period, expressed as a percentage. The same idea applies to rooms, floors and whole buildings.
Space utilization data usually includes four related measures:
- Occupancy: how many people use a space. See the glossary entry for occupancy rate.
- Density: the square footage, or the number of workstations, available per employee.
- Fluctuations in usage: how demand changes across the day and the week.
- Peak usage times: when demand is highest, which is what capacity has to cover.
In June 2021, Kadence cited JLL benchmarking that put the average desk utilization rate across industries in the United States at 60%. This figure comes from JLL’s global benchmarking report of that period; treat it as a historical reference. The workplace analytics metrics guide covers the measures to track today.
How do you measure desk utilization?
You measure desk utilization by recording which desks are used, when and for how long, then comparing that use with the desks available. The level of detail you get depends on how you collect the data. The three common methods are occupancy sensors, badge swipe data and desk booking with check-in.
Occupancy sensors
Occupancy sensors detect movement and tell you how many people are in a building, floor or neighborhood at any given time. They show presence, but not how a space is being used. They cannot forecast future usage, and they do not give you desk-level data.
Badge swipe data
Badge swipe data goes a step further by telling you exactly who is in an area. It shows how different employees and teams use a building: when they come in, how long they stay and which floors or neighborhoods they use.
Desk booking and check-in data
Desk booking with check-in gives the most detailed, hyperlocal view. Employees reserve a desk in advance in an app. When they arrive, a location-aware app prompts them to check in with one click. Every booking and check-in becomes a record of how each desk across the organization is used. In June 2021, Kadence described its desk booking software working this way. The check-in step is what separates a reservation from actual use.
Why does check-in data matter more than bookings?
Check-in data matters because a booking only records intent, while a check-in confirms that the desk was actually used. Without check-ins, utilization figures count reservations that nobody turned up for. With them, you know how often desks are used, for how long and by whom, and you can forecast from actual bookings.
This is also why successful desk hoteling needs office workers to check in. Check-in data shows which bookings go unused, so those desks can be released back into the pool of available workstations.
What are ghost, zombie and pirate bookings?
Ghost, zombie and pirate bookings are three common ways desk data drifts away from reality. Each makes the office experience worse for employees and makes the space harder to plan. Booking and check-in data exposes all three, so a workplace team can fix the cause rather than guess at it.
- Ghost booking: a desk is booked but not used.
- Zombie booking: a desk is booked but left empty on an ongoing basis.
- Pirate: somebody takes a desk they have not booked.
Check-in data confirms whether a desk is used by somebody without a booking and shows which bookings go unused. Over the longer term, you can work with teams to make sure the spaces on offer suit their needs, so they are less likely to book and not turn up.
How do you use desk utilization data to plan the office?
You use desk utilization data by turning usage patterns into decisions about layouts, density and team schedules. The data shows where demand is too high or too low, in real time and as a forecast, so changes to the floor plan rest on evidence instead of assumptions about who comes in.
Plan layouts around real demand
A hybrid workplace has to flex. Some people come in for quiet time, and others come in to collaborate and socialize. Desk-level data shows the balance of demand between quiet and social areas. Teams on a regular cadence book desks and meeting spaces over weeks and months. When a new project brings teams together for a period, the same data helps you avoid bottlenecks around desks and rooms. An interactive floor plan lets you test how different layouts would meet that demand.
Manage density
Too many people in a space disrupts productivity and comfort. An under-occupied office wastes resources. Utilization data shows when density is too high or too low. For example, if two teams both need regular breakout space in the same neighborhood, you can reconfigure the area or assign each team a different day so they do not compete for it.
Make space decisions with evidence
With desk-level data and forecasts, space management decisions become data-driven. You can see which areas are underused and plan changes with confidence, so decisions about how much space you need rest on actual use.
Why does desk utilization matter for employees?
Desk utilization matters for employees because the data shows what they actually need from the office. A people-first workplace offers the right balance of collaboration, communal and quiet spaces, and a simple way to book and check in. Without usage data, it is hard to know what employees need, and space plans rest on guesswork.
Understanding how the space is used lets you set up an office that is in sync with how people want to work, whether that means quiet, focused work or collaboration with colleagues. Customer stories such as how MOO improved office utilization show the same approach in practice.
Frequently asked questions
What is the difference between desk utilization and occupancy?
Occupancy counts how many people use a space at a given time. Desk utilization looks at individual desks: how often each one is used, for how long and by whom. Occupancy tells you a floor was busy; desk utilization tells you which desks carried that demand and which stayed empty.
How do you calculate a desk utilization rate?
Compare the desks, or desk hours, actually used in a period with the total available in the same period, and express the result as a percentage. Use check-in data rather than bookings, because bookings include reservations that nobody used.
Which method gives the most accurate desk utilization data?
Desk booking with check-in gives the most detailed data. Occupancy sensors count people but cannot show desk-level use or forecast demand. Badge swipe data shows who is in a building and when. Booking and check-in data shows which desk each person used, when and for how long.
What causes low desk utilization?
Unused bookings are a common cause. Ghost bookings (booked but not used) and zombie bookings (booked but left empty on an ongoing basis) hold desks that others could use. Check-in data identifies them so unused desks can be released back into the pool.
Is the 60% desk utilization benchmark still current?
The 60% average desk utilization rate for U.S. industries comes from JLL’s global benchmarking report, cited by Kadence in June 2021. Treat it as a historical reference and measure your own buildings with check-in data.