Welcome To Kadence Pulse
Kadence Pulse is our new data-driven series where we uncover key trends in hybrid work, using insights straight from Kadence’s platform. Our goal is to help businesses and employees understand how hybrid work is evolving and how they can make smarter, more informed decisions.
How Often Are Hybrid Workers Coming Into The Office?
The way we work has changed forever, and at Kadence, we have the data to prove it. Our booking platform captures real-world hybrid work patterns, revealing insights into how employees are actually using their office spaces. And the data is clear: the magic number is 2.
Across our entire customer base, the most common number of days employees book to come into the office each week is two. But what’s driving this trend? And how does it vary by region and industry? Let’s take a deep dive into the data.
The Overall Trend: A Steady Climb Toward Three Days?
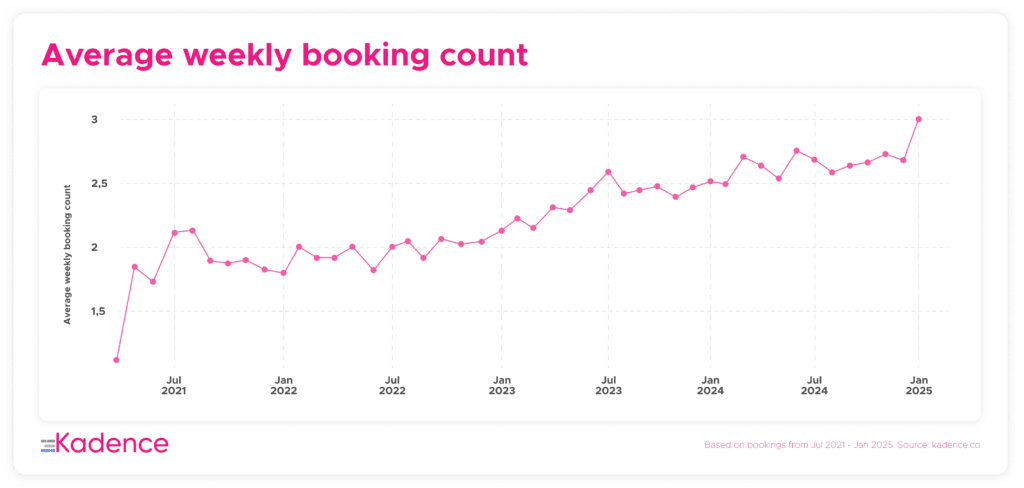
We started by analyzing the average number of weekly office bookings per user over time. This includes all booking types—whether employees checked in, canceled, or simply reserved a desk.
Key Insight: The weekly average fluctuates between 2 and 3 days, with a slow upward trend over time. If this continues, we could eventually see 3 days per week becoming the norm.
But what happens when we strip away the canceled bookings?
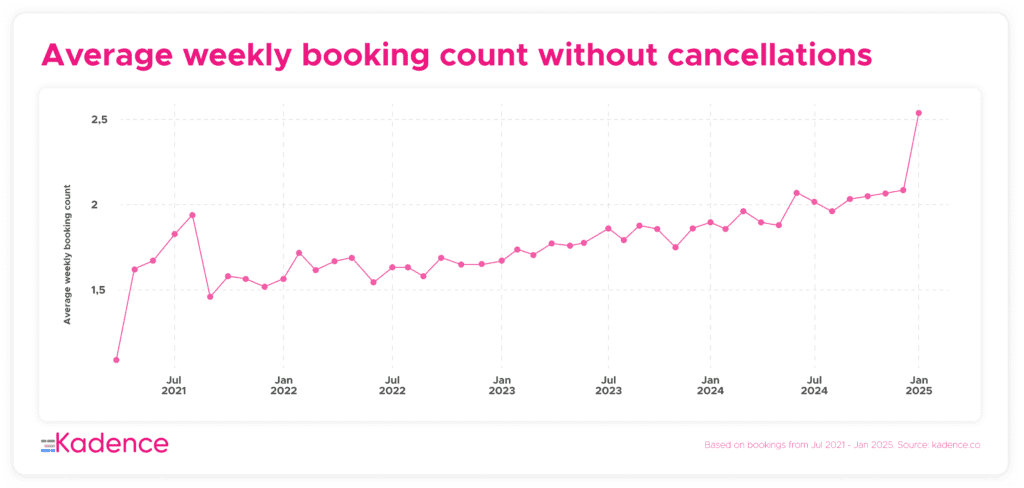
The Reality Check: The True Average Is 2 Days
By removing canceled bookings, we get a clearer picture of actual office attendance.
Key Insight: The average drops closer to 2 days per week. This suggests that while employees may initially plan for 3 office visits, in reality, they only make it in twice.
Why? A few possibilities:
- Employees book for three days but adjust plans last minute.
- Hybrid work is inherently flexible—some employees swap one day for another, leading to apparent overbooking.
- Companies might encourage 3-day attendance, but employees naturally gravitate toward 2.
Regional Breakdown: Who’s In The Office The Most?
Next, we broke down attendance by building region to see how different parts of the world approach hybrid work.
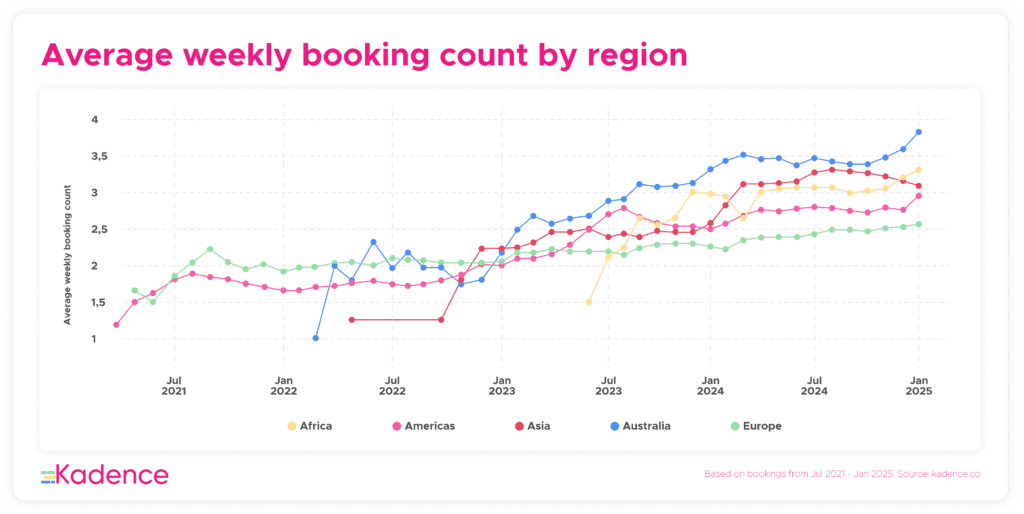
With Cancellations Included:
- Australia leads the way, with employees booking office space the most.
- Europe lags behind, with fewer bookings per week and little sign of upward movement.
Without Cancellations:
- Australia still tops the list, but the actual attendance rate is closer to 2.5 days per week rather than 3.
- Europe is even lower, averaging 1.5 days per week.
This tells us that while hybrid is a global trend, regional work cultures play a huge role in how it’s adopted.
Industry Breakdown: Who Books The Most?
Different industries have different needs when it comes to in-office collaboration. Here’s what our data shows:
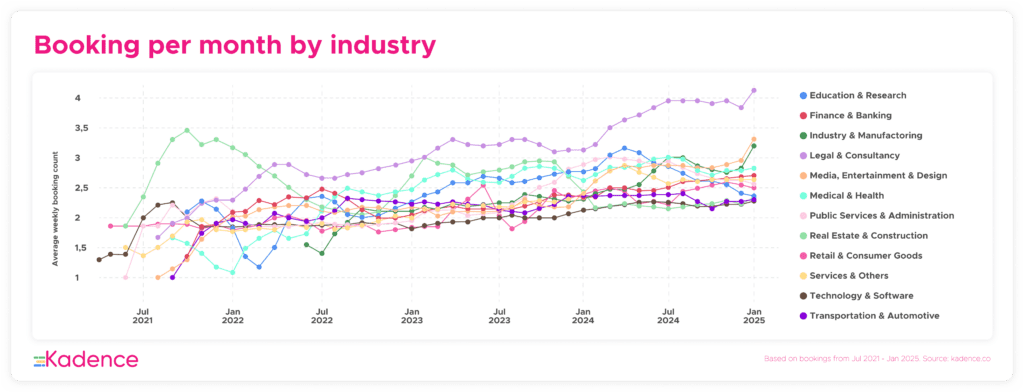
With Cancellations Included:
- Legal and Consulting have the highest number of office bookings.
- Transport and Automotive book the least.
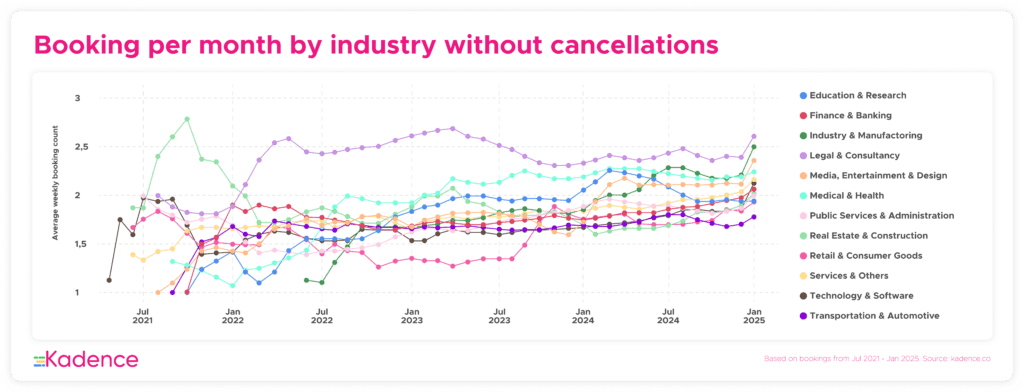
Without Cancellations:
- Legal and Consulting remain at the top, with Medical and Health close behind.
Why the variation? Some industries, like legal and consulting, rely heavily on in-person meetings and client collaboration. Others, like tech and transport, can function more efficiently in a remote-first setup.
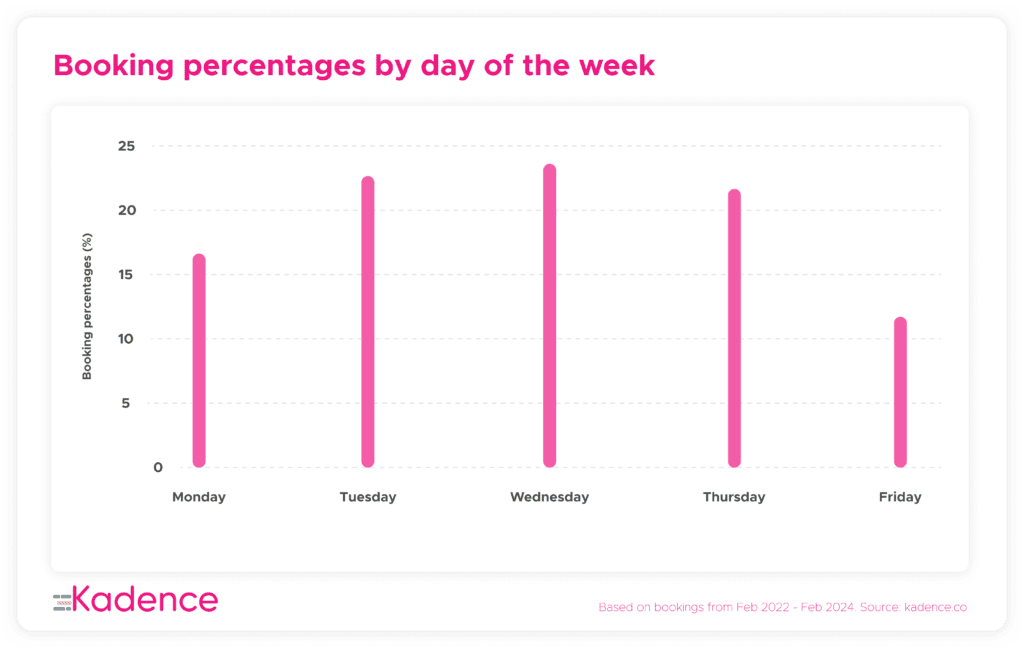
Most Popular Office Days: The Midweek Sweet Spot
When do people prefer to come in? Our data shows a strong preference for midweek office visits.
Key Insight: Mondays and Fridays are the least popular days.
Hybrid workers tend to structure their schedules to work from home on Mondays and Fridays, reserving Tuesdays, Wednesdays, and Thursdays for in-office collaboration. This aligns with the broader shift toward a midweek office presence.
Regional and Industry Trends:
- The trend is consistent across regions—Monday and Friday see the lowest office traffic everywhere.
- Some industries, like consulting and finance, still maintain higher midweek attendance.
How Far In Advance Do People Book?
Another interesting insight: the majority of bookings happen close to the date of use.
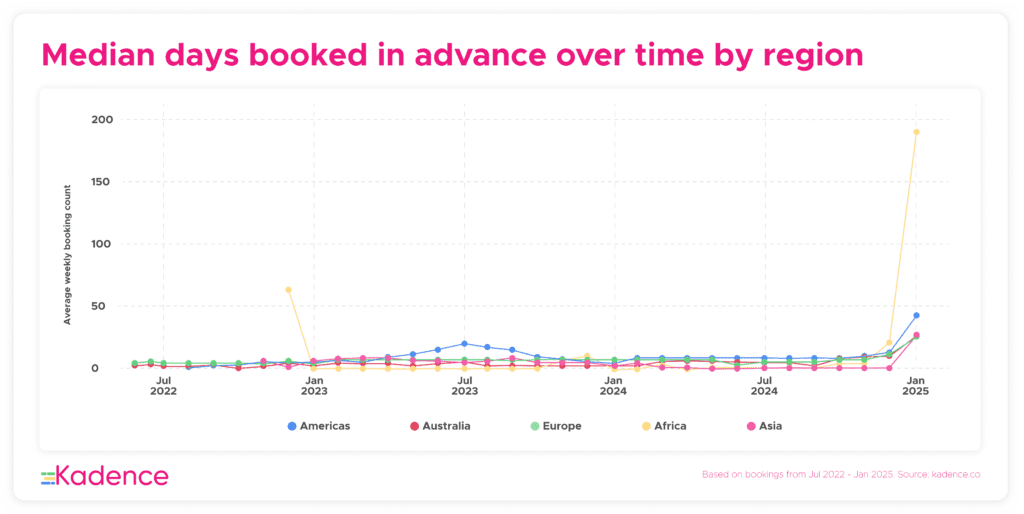
To measure this, we used the median booking lead time to avoid outliers skewing the data.
Key Insight: A noticeable spike in bookings occurs in January.
What’s behind this? Likely a mix of new company policies, fresh start energy, and employees making good on their New Year’s resolutions to be more present in the office.
Final Thoughts: What Does This Mean For Hybrid Work?
So, what do we take away from this?
- 2 days per week is the sweet spot. While some companies aim for 3, actual attendance suggests employees naturally prefer 2.
- Mondays and Fridays are dead zones. If your office feels quiet on these days, you’re not alone.
- Industry and regional differences matter. Not all hybrid strategies will work everywhere—business leaders should consider local culture and industry norms when designing hybrid policies.
At Kadence, we believe hybrid work should be data-driven, flexible, and employee-first. Understanding the trends behind office usage can help businesses create a smarter, more efficient hybrid strategy that actually works for their teams.
Stay tuned for the next Kadence Pulse as we continue to uncover the data behind the future of work.
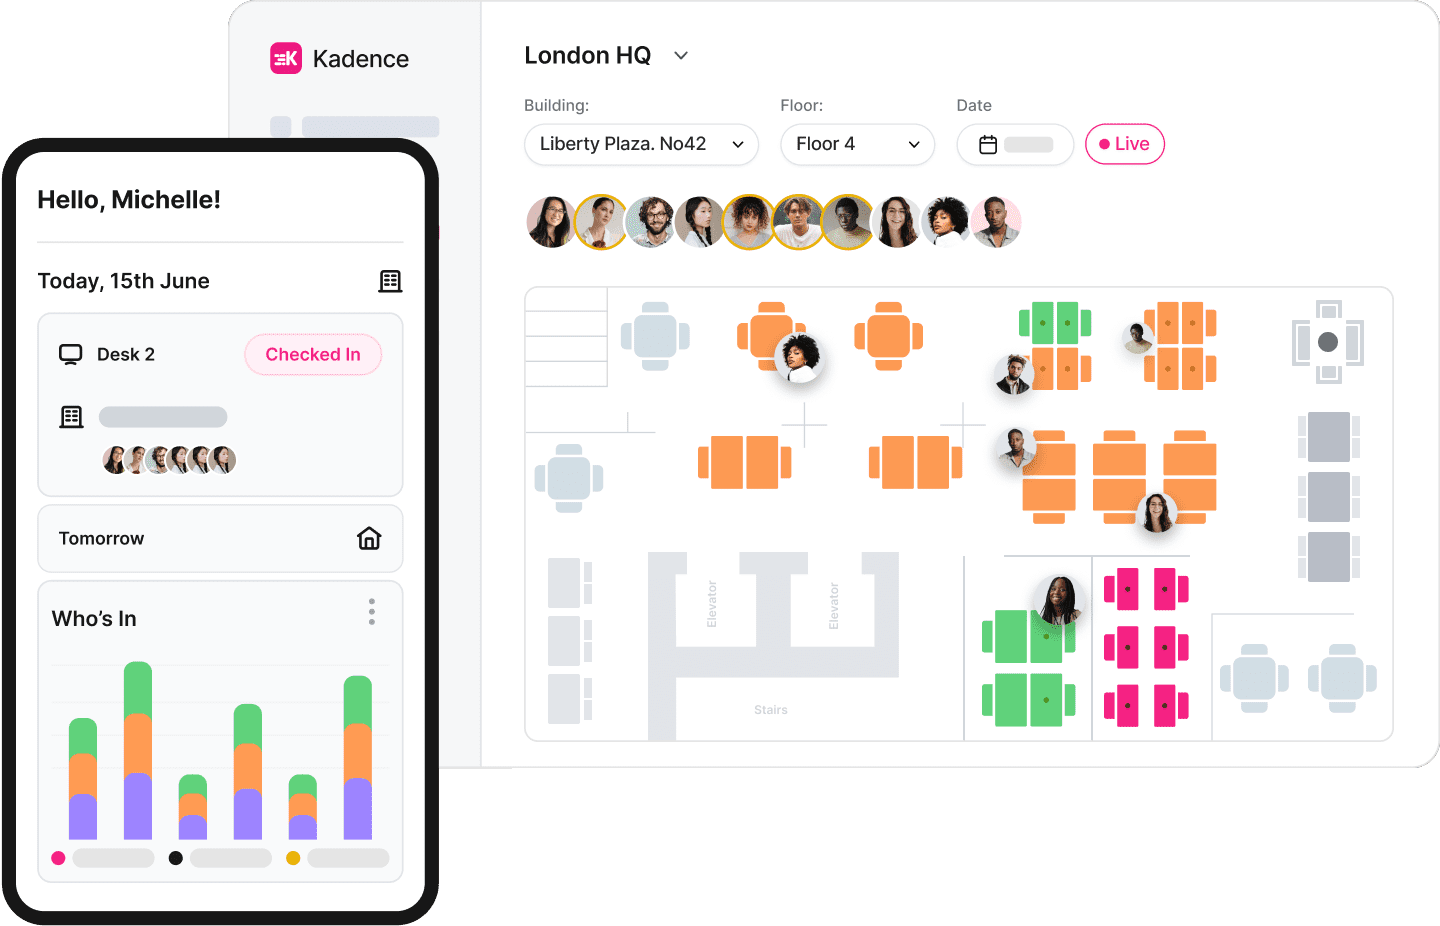
If you would like to see how Kadence can help you track how your teams use your office spaces, talk to one of our hybrid experts.