Welcome to Kadence Pulse. This series uses aggregated and anonymized data from Kadence customers to understand how workplace behavior is changing at scale. Rather than focusing on individual offices or policies, each Pulse looks at a single signal in the data and what it reveals about how workplace operations actually function.
I’m Ali Carson, a Data Scientist at Kadence. My role is to analyze patterns across thousands of workplaces and millions of bookings to understand how people really use offices day to day. In this edition of Kadence Pulse, I’ve been exploring how cultural differences show up in workplace behavior and how closely those patterns align with recent academic research.
A new study published in the Proceedings of the National Academy of Sciences provides a useful starting point. Analyzing data from more than 14,000 full-time, college-educated workers across 37 countries, the researchers found that cultural individualism explains around 29 percent of cross-country variation in work-from-home behavior. This is a larger share than industry mix, population density, or economic development.
That research explains why hybrid schedules differ by country. What it cannot show is how those differences translate into everyday workplace operations. That’s where Kadence data becomes useful.
How the Data Was Structured
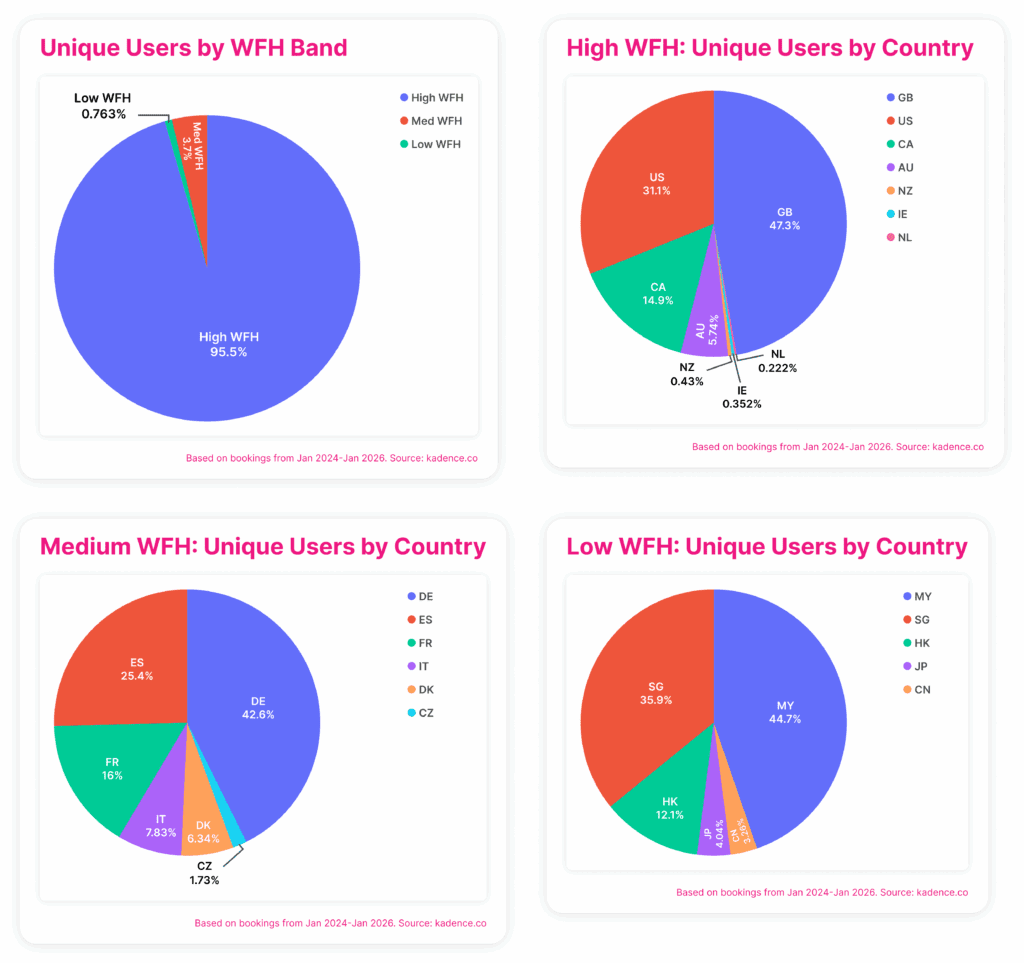
The PNAS paper reports average paid work-from-home days per week at a country level. Based on the ranges described in the paper, countries naturally cluster into three groups: those averaging roughly 1.3 or more work-from-home days per week, those between around 0.9 and 1.3 days, and those averaging fewer than 0.9 days.
Using those country-level averages as a reference point, I grouped Kadence data into the same three categories. I then limited the analysis to companies with more than 5,000 total bookings and to countries with sufficient booking volume between 2024 and 2026. This helps ensure the patterns reflect stable workplace operations rather than early adoption or policy transition effects.
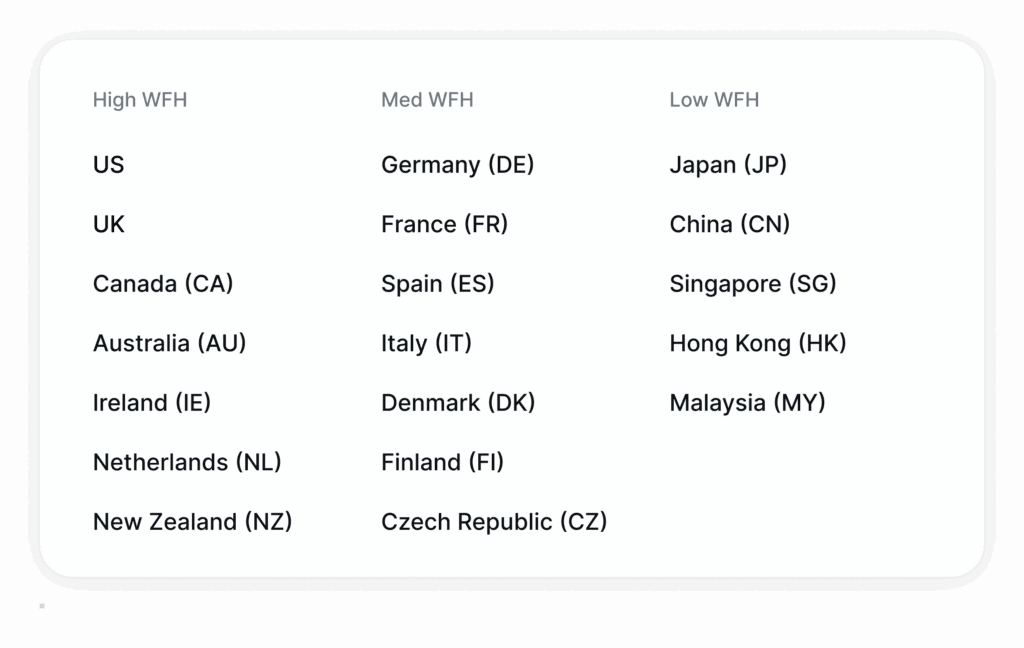
The resulting dataset spans high, medium, and low work-from-home countries across North America, Europe, and Asia.
Onsite Presence Follows the Same Pattern
When I look at Kadence data through this lens, the first signal is clear. Countries that work from home more in the PNAS data also show lower onsite presence in Kadence data.
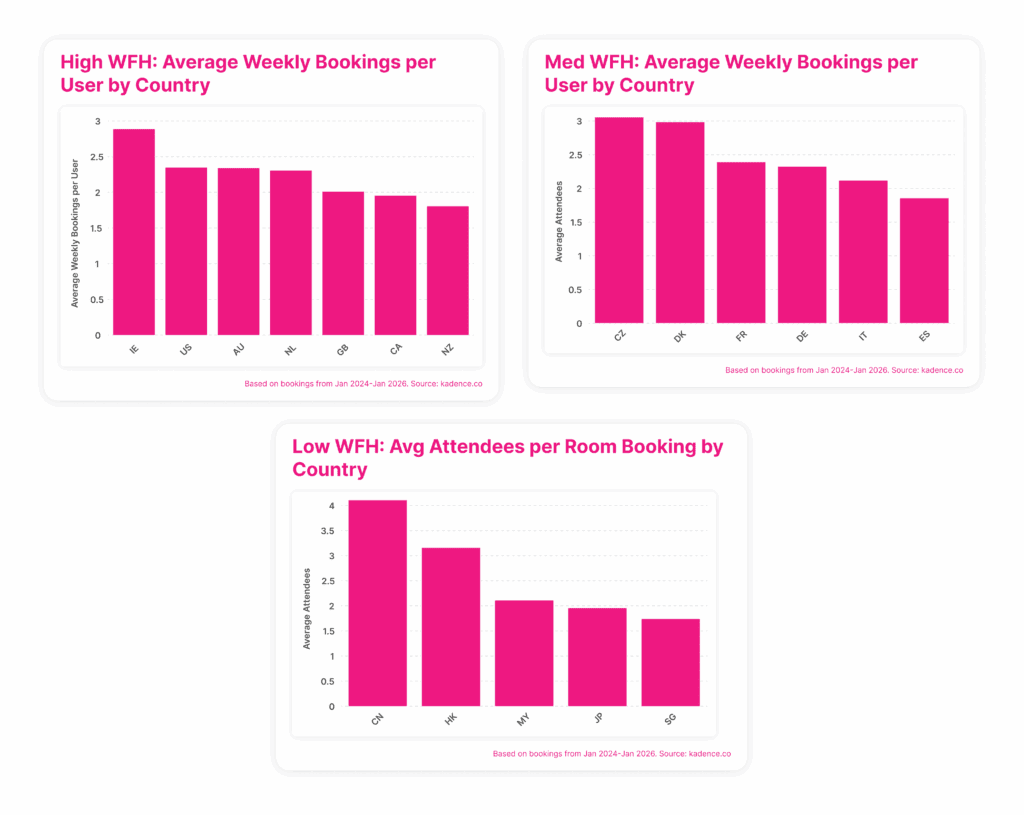
This pattern is visible in the country-level averages shown below. In the high work-from-home group, countries such as the US, UK, Canada, and New Zealand cluster toward the lower end of average weekly onsite bookings per user. By contrast, countries in the low work-from-home group show consistently higher averages, while medium work-from-home countries sit between the two. Across all three groups, there is meaningful overlap within each band.
Measured as the average number of days per week with a non-cancelled onsite booking per active user, high work-from-home countries consistently sit lower than medium and low work-from-home countries.
Aggregated by band, the median onsite presence is 1.68 days per week in high work-from-home countries, 1.97 days in medium work-from-home countries, and 1.88 days in low work-from-home countries. The differences are real, but they are not extreme. This mirrors the PNAS finding that culture shapes how often people work remotely, without suggesting a sharp or binary divide between countries.
Predictability Reveals a Clearer Cultural Signal
Where cultural differences become more pronounced is not just in frequency, but in predictability.
To understand this, I looked at how consistently people come into the office over time. A user is considered consistently onsite if they have at least one onsite booking in 80 percent of the weeks during the period they are active.
Using that definition, 55 percent of users in high work-from-home countries show a consistent onsite pattern. In medium work-from-home countries, that figure rises to 64 percent. In low work-from-home countries, it reaches 68 percent.
This suggests that culture influences how reliably teams coordinate shared time. In lower work-from-home countries, onsite presence tends to be more predictable week to week. In higher work-from-home countries, presence is more flexible and variable.
Up to this point, Kadence data behaves exactly as the PNAS study would lead us to expect.
What Happens Once People Are in the Office
Frequency and predictability tell us when people come in. They do not tell us how the office is actually used.
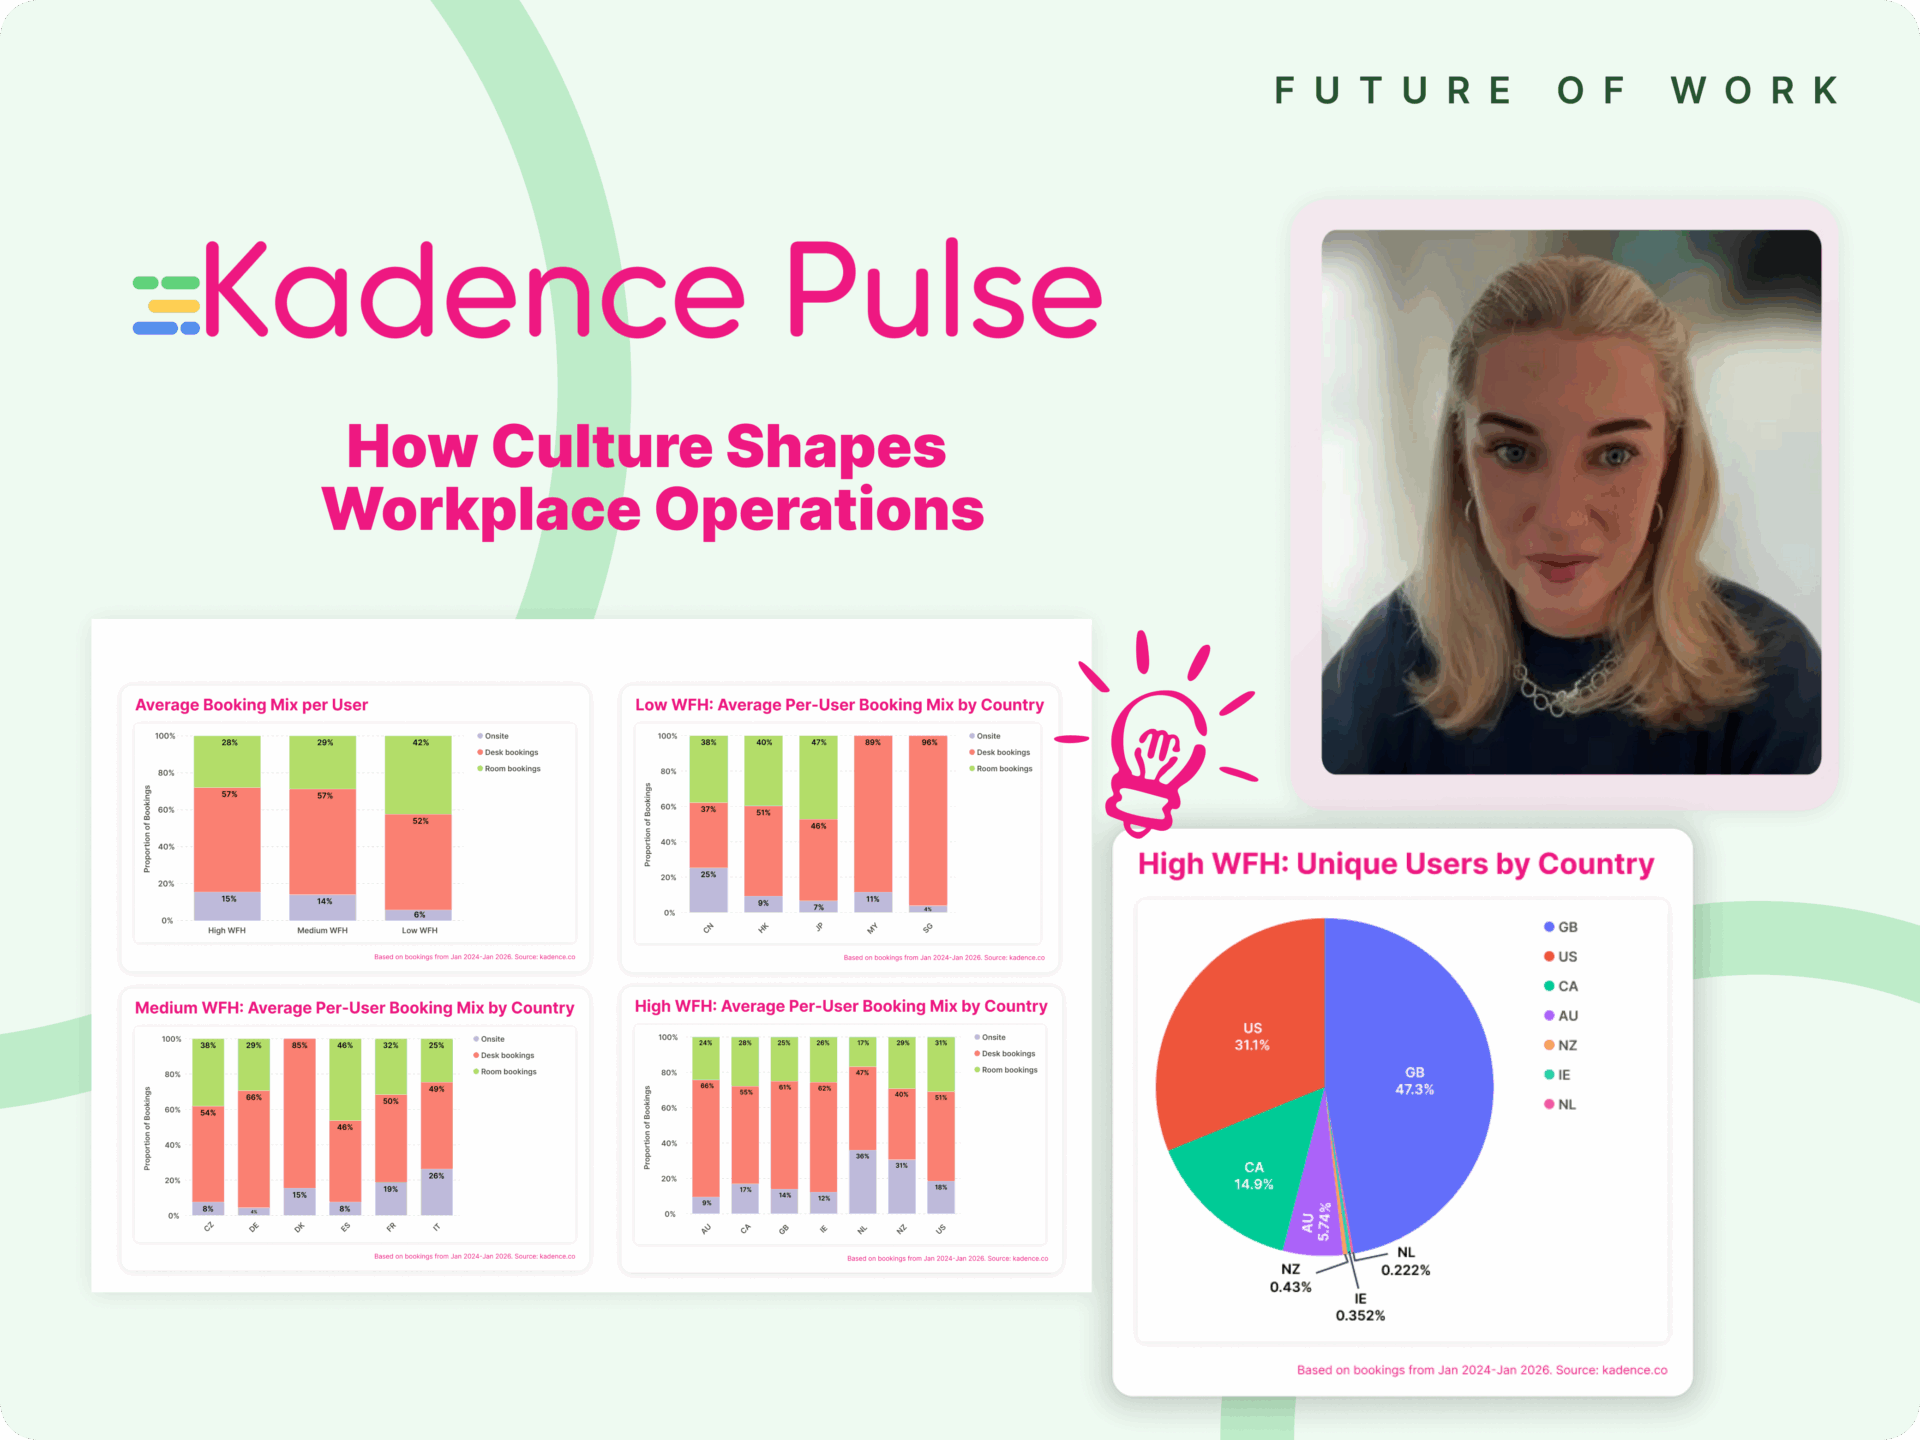
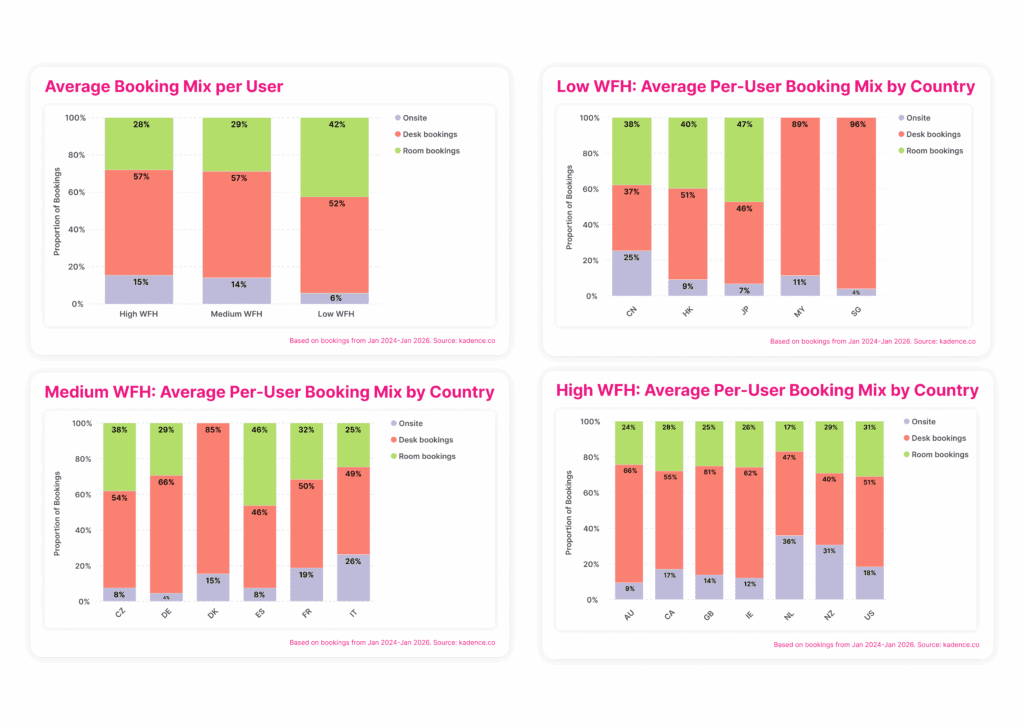
When I look at booking behavior on onsite days, the differences between countries narrow considerably. Across all three work-from-home groups, desk bookings dominate, accounting for just over half of all activity in every band. In high and medium work-from-home countries, desk bookings make up 57 percent of bookings per user, while in low work-from-home countries they still account for a majority at 52 percent.
Room bookings also remain remarkably consistent across groups. They account for 28 percent of bookings in high work-from-home countries, 29 percent in medium work-from-home countries, and rise to 42 percent in low work-from-home countries. Even where attendance is higher, the balance between individual and collaborative space does not fundamentally change.
Looking within each group, country-level variation exists, but it sits within a relatively tight range. Some countries lean slightly more toward desks or rooms, but no group shows a fundamentally different office usage model.
This convergence extends to how intensively people use the office once they arrive. When I measure the average number of bookings per active user on onsite days, the values remain broadly comparable across all three groups, reinforcing that higher attendance does not translate into a different pattern of space use.
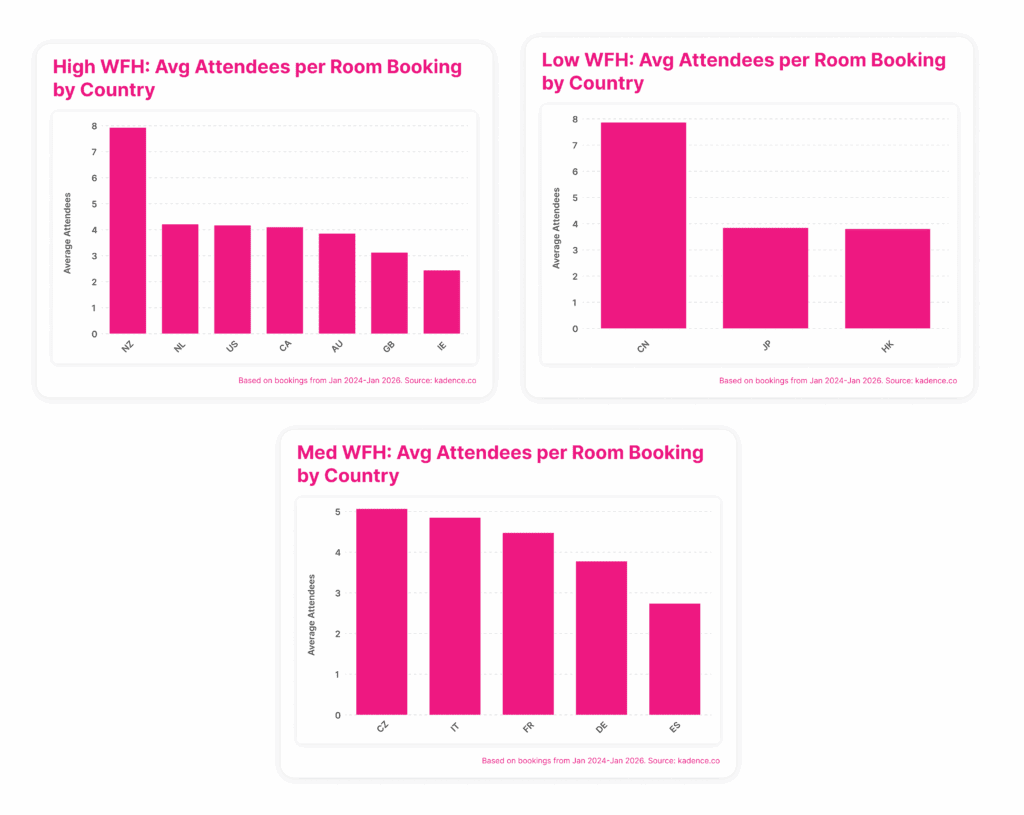
Collaboration patterns show only modest differences across countries. The charts below show average room booking size by country, and across high, medium, and low work-from-home groups, most countries cluster within a relatively narrow range of meeting sizes.
Looking at the underlying distributions, the median room booking size is two people in both high and medium work-from-home countries, and three people in low work-from-home countries. Average room size increases slightly from high to low work-from-home groups, but the shift is incremental rather than structural, reflecting slightly denser collaboration rather than a different way of working.
Taken together, the data suggests that culture shapes when people come into the office, but not what the office is used for once they arrive.
What This Means for Workplace Operations
For global organizations, this distinction matters.
Attendance rhythms differ by country, and attempts to standardize expectations around presence often run into cultural friction. The data supports that reality. At the same time, the convergence in in-office behavior suggests that organizations do not need entirely different office models in different regions.
Desk demand dominates everywhere. Collaboration space remains a minority share. The intensity of office use on onsite days is broadly similar.
The operational challenge is not designing different workplaces for different cultures. It is running workplace systems that can accommodate local attendance rhythms while supporting consistent, reliable use across regions.
Kadence helps workplace teams see these patterns clearly. By benchmarking behavior across countries and understanding how culture shows up in real usage data, organizations can design workplace operations that reflect how teams actually work.
See how Kadence helps organizations run better workplace operations. Book a demo with our workplace operations experts.