Welcome to Kadence Pulse. This series uses aggregated and anonymized data from Kadence customers to understand how workplace behavior is changing at scale.
I’m Ali Carson, a Data Scientist at Kadence. My role is to analyze workplace data to understand how offices are really being used day to day. In this edition of Kadence Pulse, I’ve been looking at a different kind of space problem: not empty portfolios, but oversized floors hidden inside otherwise active estates.
One of the easiest mistakes in workplace planning is to assume that if there is meaningful demand across a portfolio, every part of it must be working well.
Our latest enterprise analysis suggests otherwise. Some workplaces show clear signs of demand across the wider estate, but when you examine them floor by floor, a different pattern appears: specific floors carry far more desks than real demand requires. The problem is not obvious in the average. It only becomes visible in the detail.
Meaningful Portfolio Demand Can Still Hide Oversized Floors
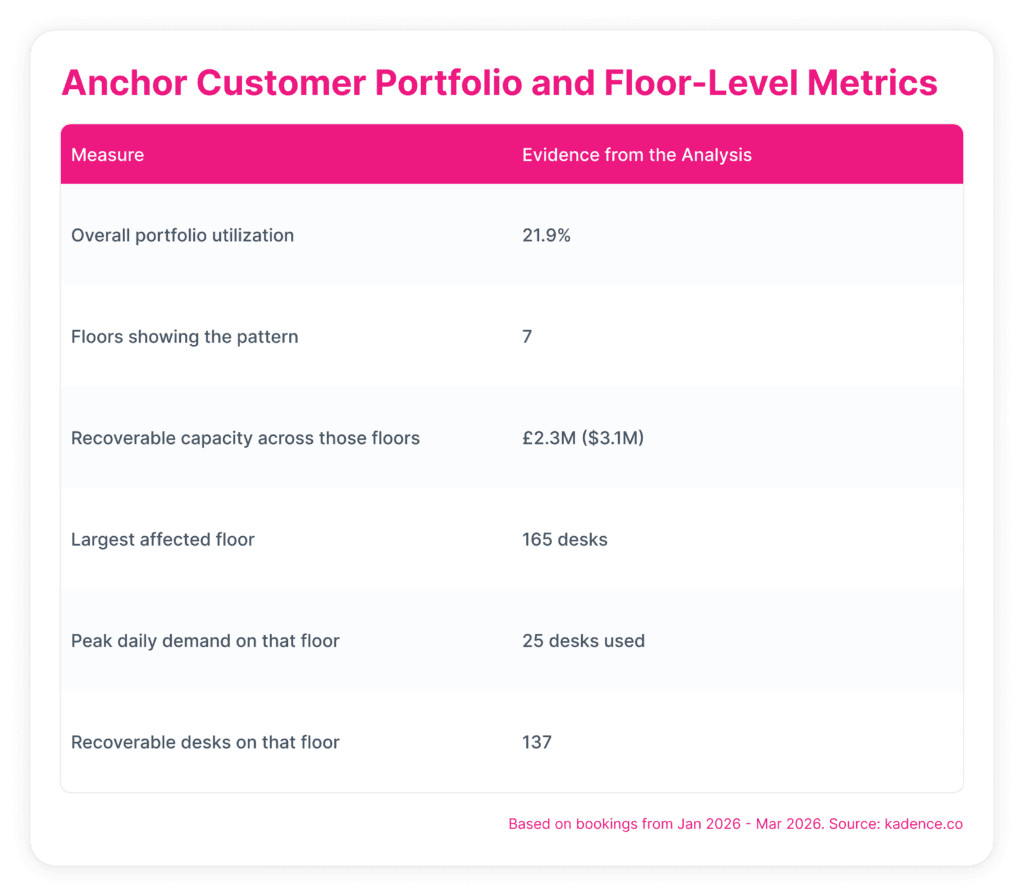
One anonymized enterprise customer in the analysis makes the point clearly. This customer operates a large multi-site portfolio with 21.9% overall utilization. On its own, that number does not tell you where the real mismatch sits. But within that same estate, seven floors show a very different pattern, representing £2.3M in recoverable capacity under a conservative model.
The clearest example sits on a single floor with 165 desks. On its busiest day in the quarter, only 25 desks were used. That means the floor is effectively set up for around six times more demand than it actually sees. Even using a peak-based calculation with a buffer, the analysis still identified 137 recoverable desks on that one floor.
That is the first point of this piece. Space planning can break at floor level long before it becomes visible at portfolio level.
You might expect a floor like this to sit inside a portfolio with very little activity at all. In this case, it does not. That is exactly why it matters. The wider estate shows meaningful usage, but the underlying floor-level mismatch could still be missed.
This Is Not A One-Off
What made this finding worth publishing was not one striking floor. It was the fact that the same pattern appeared again and again.
Across four anonymized enterprise customers, in four different sectors and four different countries, we found floors sized for roughly 5 to 15 times their real daily demand, even where the wider portfolio still showed meaningful usage overall. Across those four examples, the analysis identified £3.4M in recoverable capacity.
The repeated pattern is the real insight. This is not one customer anomaly. It is a type of floor-level mismatch that shows up across very different enterprise environments.
At floor level, the numbers are strikingly consistent. Across the four clearest examples, recoverable capacity per floor ranges from roughly £229k to £330k, even though the organizations are in different sectors and geographies. That consistency helps show that the story is not being driven by one unusual customer.
The Real Issue Is Uneven Demand, Not Empty Offices
This is not a story about broad underuse across whole estates.
In the underlying analysis, the clearest examples were separated from a different group of customers where the real issue was broader underuse or lower product adoption. Those cases matter, but they point to a different operational problem. The story here is more specific: otherwise active portfolios can still contain floors that no longer match demand.
That distinction matters because the same analysis becomes a different story once team-assigned floors are brought back in. When those floors are included, the recoverable opportunity rises from £9.0M across 10 customers to £28.6M across 21 customers. But most of that additional scale comes from dedicated team space that appears oversized for how it is actually used. That is a valid planning problem, but it is a different one. In this piece, I’m focusing on the cleaner floor-level mismatch pattern in open and mixed space, where the signal is most consistent.
That distinction also changes how the reader should interpret the findings. The question is not simply whether space is being used. It is whether each part of the estate is aligned with how people actually use it. In some cases, that means open floors with more desks than demand justifies. In others, it means dedicated team space that no longer reflects how a team works. Both are important, but they are not the same story.
For this analysis, the strongest and most repeatable pattern sits in the first category: specific outlier floors inside otherwise active estates, where the mismatch only becomes obvious when the data is examined floor by floor.
The Strongest Proof Sits Inside The Same Estate
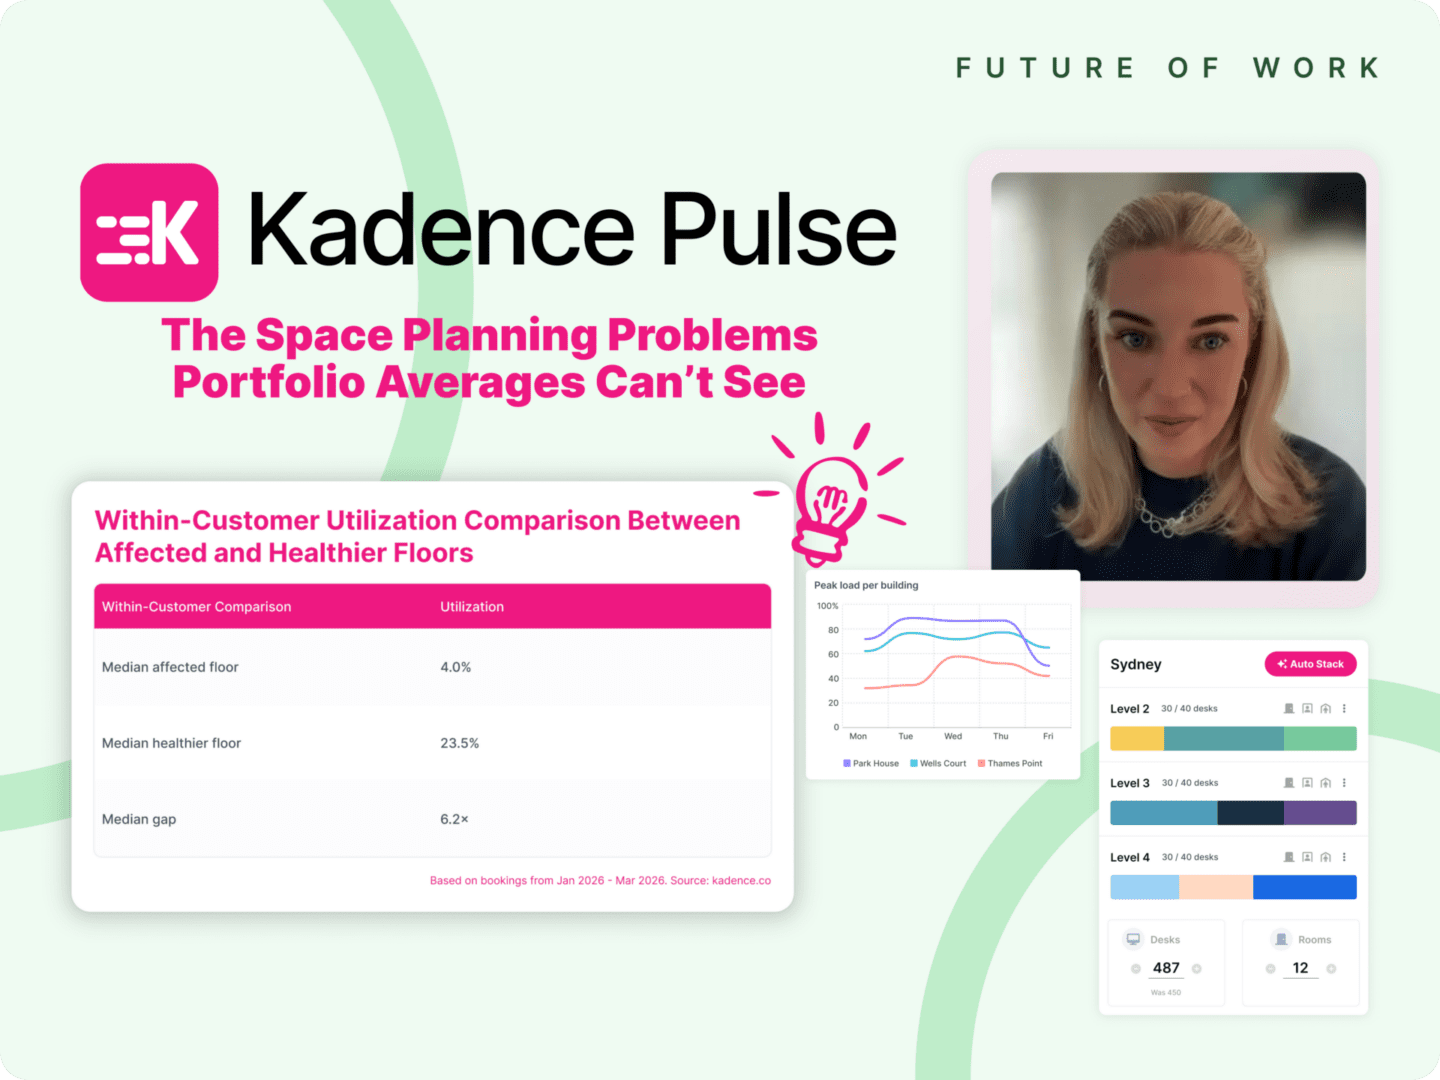
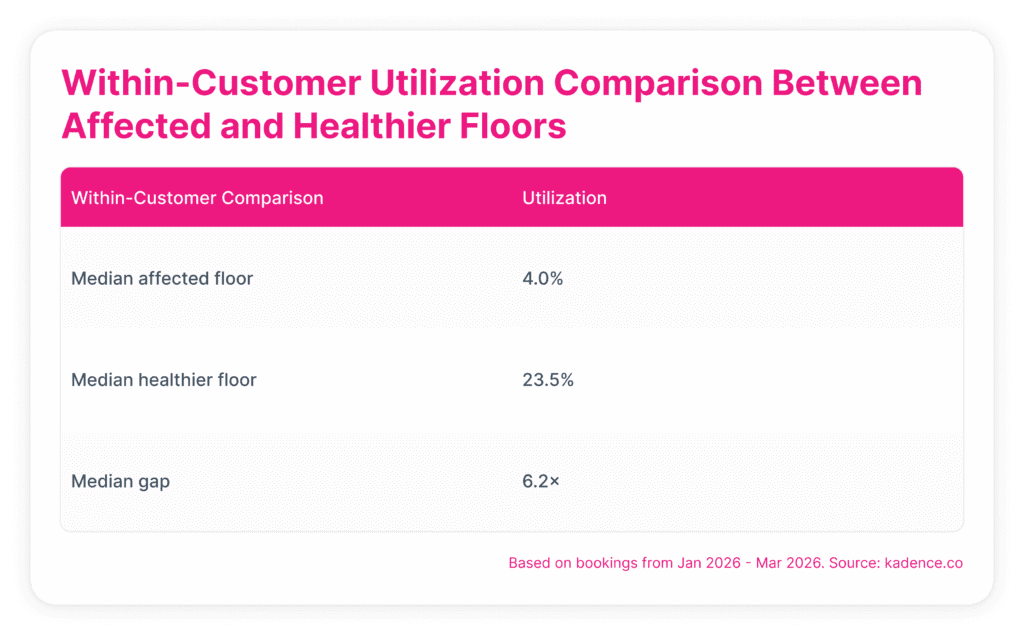
One of the strongest signals in the analysis came from comparing affected floors with healthier floors inside the same customer portfolios.
Among customers with both kinds of floors, median utilization on the affected floors was 4.0%. On healthier floors, it was 23.5%. That is a median within-customer gap of 6.2x.
This matters because it shows the mismatch is not just visible across different companies. It is visible inside the same estate, where some floors are performing normally and others are dramatically oversized for the demand they actually see.
You might assume this kind of inefficiency only shows up when a whole portfolio is underperforming. The comparison above suggests otherwise. In many cases, the biggest difference is not between companies. It is between floors inside the same company’s estate.
Why Average Utilization Misses It
Portfolio averages are useful, but they can flatten the differences that matter most.
The analysis shows that a building averaging 20% utilization can still contain one floor running at 40% and another at 3%. At that level of reporting, the building looks broadly fine. But the floors that need action are hidden inside the average.
That is the broader workplace operations lesson here. The problem is not that teams lack utilization data. It is that the wrong level of data can make space look healthier than it really is.
Why The Numbers Hold Up
Findings like these invite scrutiny, and they should.
This analysis uses completed bookings only, which means the demand signal is based on checked-in activity rather than reservations that were never used.
It also filters out floors that are mostly assigned seating by excluding any floor where more than 70% of desks sit in team neighborhoods. In fact, 57% of floors in the initial cut were removed on that basis, making the remaining pattern more defensible.
And the savings estimate is conservative. Rather than treating every empty desk as removable, recoverable capacity is sized against the 90th percentile of daily desk demand and then given a further 15% buffer. In other words, this is not average emptiness multiplied by rent. It is a more cautious estimate of capacity that sits beyond real peak demand.
What This Means For Workplace Operations
The practical takeaway is simple. Space performance should not be judged only by how full the portfolio looks overall. It should also be judged by how well each floor is aligned to actual demand.
In this analysis, one anonymized enterprise customer showed 21.9% overall utilization, yet still contained seven floors with £2.3M in recoverable capacity. On the clearest example, 165 desks supported peak daily demand of just 25 people. Across four anonymized enterprise customers, the same floor-level pattern appeared again and again, with wider estates still showing meaningful usage while specific floors remained sized for 5 to 15 times real daily demand. And within the same estates, healthier floors were used 6.2x more than the affected floors.
Taken together, those numbers point to a more useful question for workplace leaders. Not simply, “How utilized is our estate?” but, “Which specific floors are mismatched to demand, and what should we do about them?”
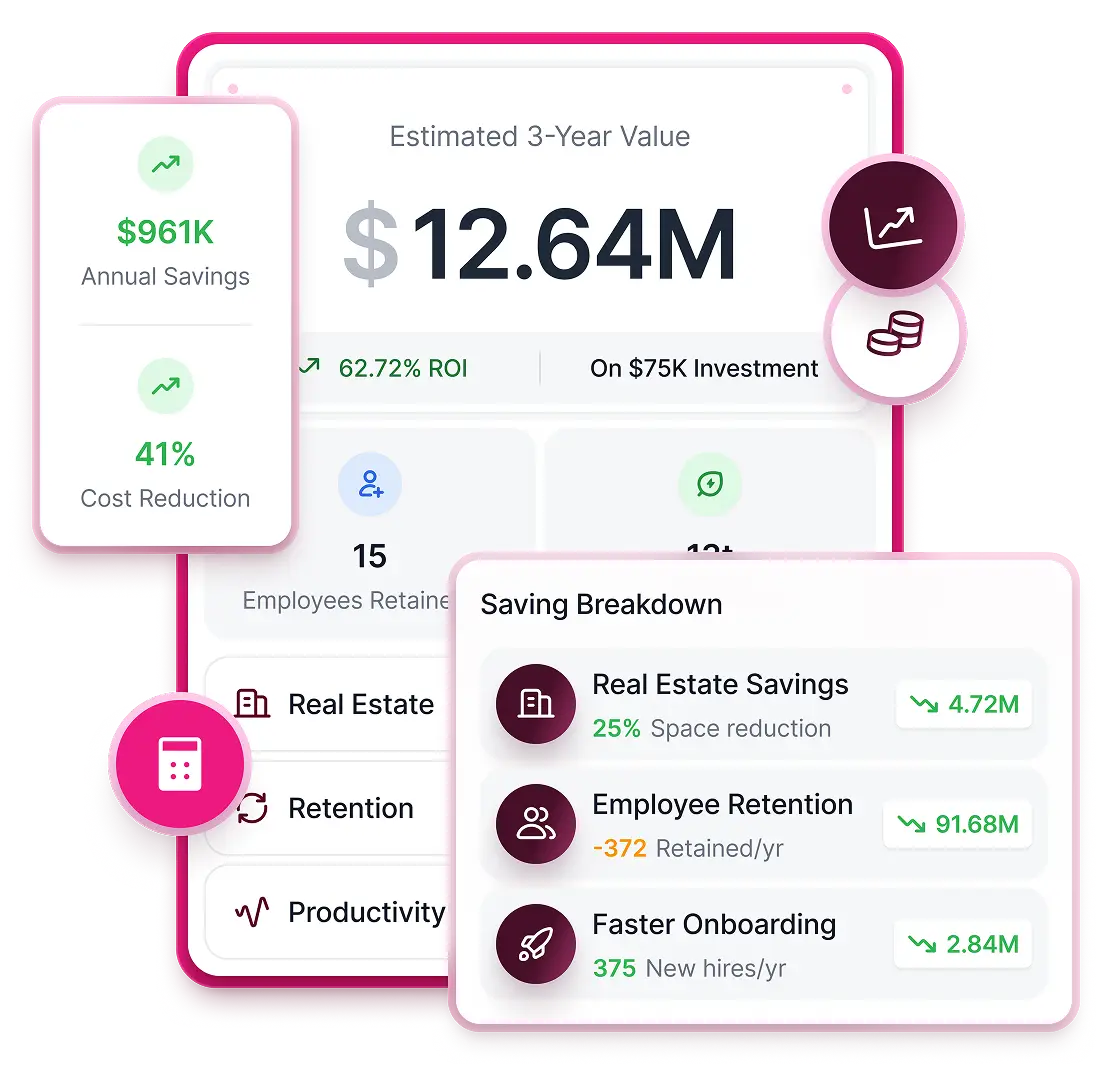
Calculate the ROI of Your Workplace Operations
Our brand-new ROI Calculator is here to help you visualize your success in seconds.
Where Kadence SpaceOps Comes In
That is where Kadence SpaceOps comes in.
If the problem is hidden floor-level mismatch, the answer is not more portfolio-level reporting. It is the ability to identify outlier floors clearly, understand how capacity compares to real demand, and model what happens next. Kadence SpaceOps helps workplace teams do exactly that: surface the floors that are out of step with demand, explore consolidation and restacking options, and plan how space can be repurposed or retained with more confidence.
The point is not that every organization has too much space. It is that some of the most important space decisions are hidden in the detail, and portfolio averages alone will not always reveal them. When a floor built for 165 desks only ever needs 25 on its busiest day, the issue is no longer just utilization reporting. It is a planning problem. And planning problems need better visibility, better modeling, and better operational tools.
See how Kadence SpaceOps helps organizations make better space decisions. Book a demo with our workplace operations experts.