Hybrid attendance has quietly broken the way most offices are planned. Space was once allocated against headcount and left alone, but when attendance varies day to day, that logic no longer holds, and most workplace leaders cannot confidently answer a basic question: how is our space actually being used? Office space utilization is what answers it. This guide covers how to measure utilization, why so much of the data is unreliable, and how to turn it into occupancy planning and floor plan decisions.
Office space utilization is the measure of how much of an office is actually used, and how, over a period of time rather than at a single moment. It is the pattern of real activity across desks, rooms, and floors, expressed against the capacity available.
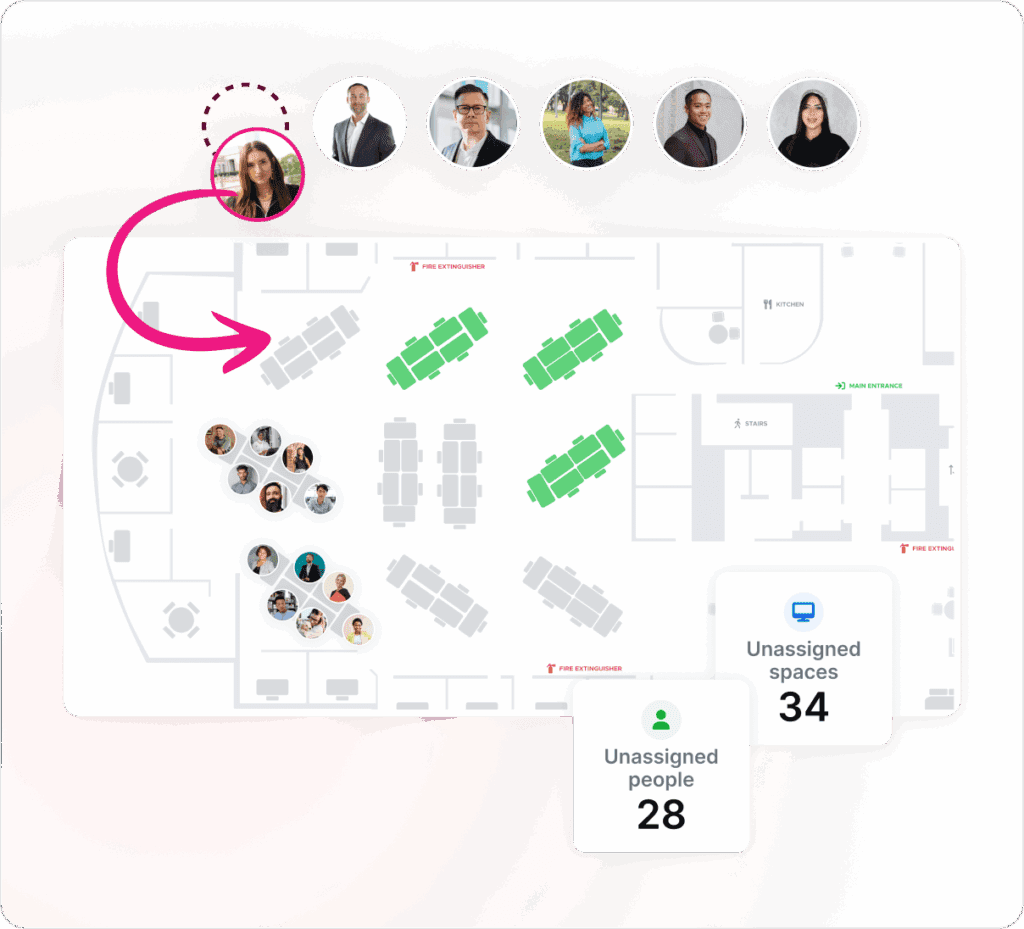
What Is Office Space Utilization (and Why It Matters Now)
Office space utilization measures how much of a workplace is used, and how effectively, across a period of time. It differs from raw occupancy, which is a single snapshot of how many people are present at one moment. Utilization is the pattern those snapshots form over days and weeks, which is what makes it useful for decisions rather than just observation.
That distinction matters more now than it used to. Hybrid attendance varies enough that a Tuesday and a Friday can look like two different buildings, so a one-day headcount tells a leader almost nothing about what the organization actually needs. At the same time, lease commitments run for years and finance teams are pushing to reduce real estate cost per employee. The result is a hard question that static org charts and assumptions can no longer answer with confidence: what do we actually need? Utilization data, gathered properly, is how that question gets answered.
Why Is Most Office Utilization Data Unreliable (and What Good Data Looks Like)
Most office utilization data is unreliable because it is built from proxies rather than behavior. Badge swipes, manual counts, and headcount assumptions capture who entered a building or who was assigned a desk, not how space was actually used through the day. That produces numbers a workplace leader cannot defend when leadership starts asking questions.
Good utilization data looks different in four ways. It captures behavioral signal from real workplace activity rather than inferring use from a turnstile. It covers desks, rooms, and neighborhoods separately rather than collapsing everything into a single building-level figure. It reflects longitudinal patterns over weeks, not a single representative day that may not be representative at all. And it distinguishes what was booked from what was actually used, which is where most reporting quietly overstates demand. Data that meets that bar becomes decision-grade intelligence, defensible enough to justify a lease, a consolidation, or a redesign. Data that does not turns million-dollar decisions into educated guesses that fall apart under scrutiny.
What Are the Key Office Space Utilization Metrics to Track
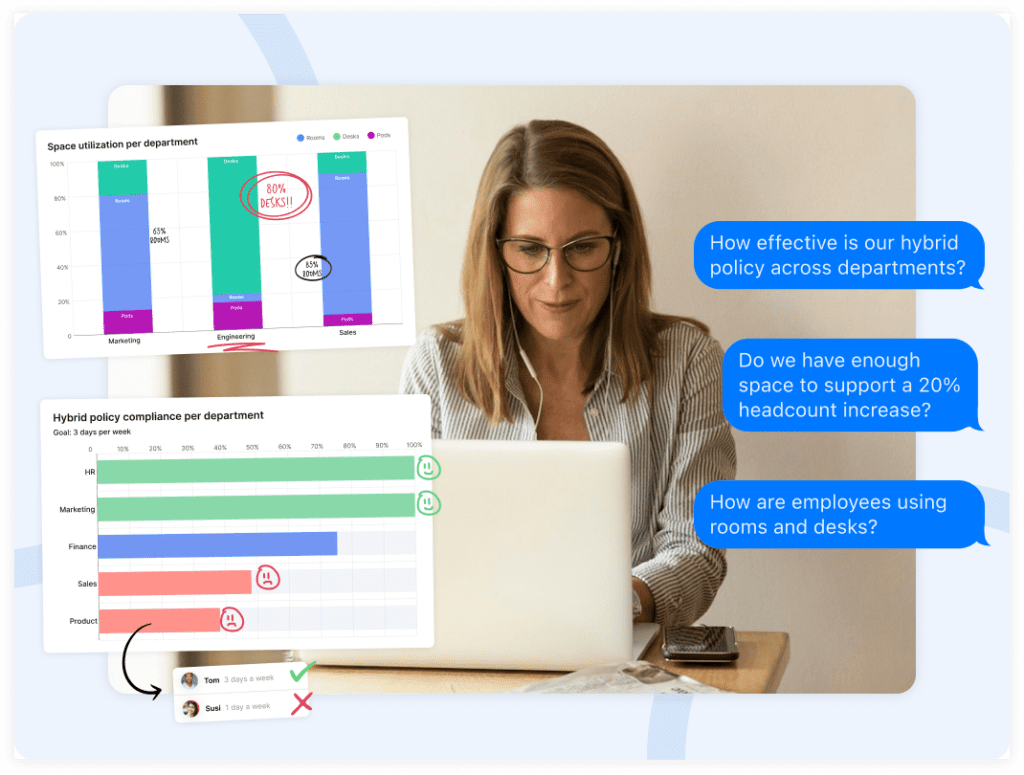
The office space utilization metrics worth tracking are the ones that drive a decision, not the ones that just fill a dashboard. Five carry most of the signal.
Office Occupancy Rate
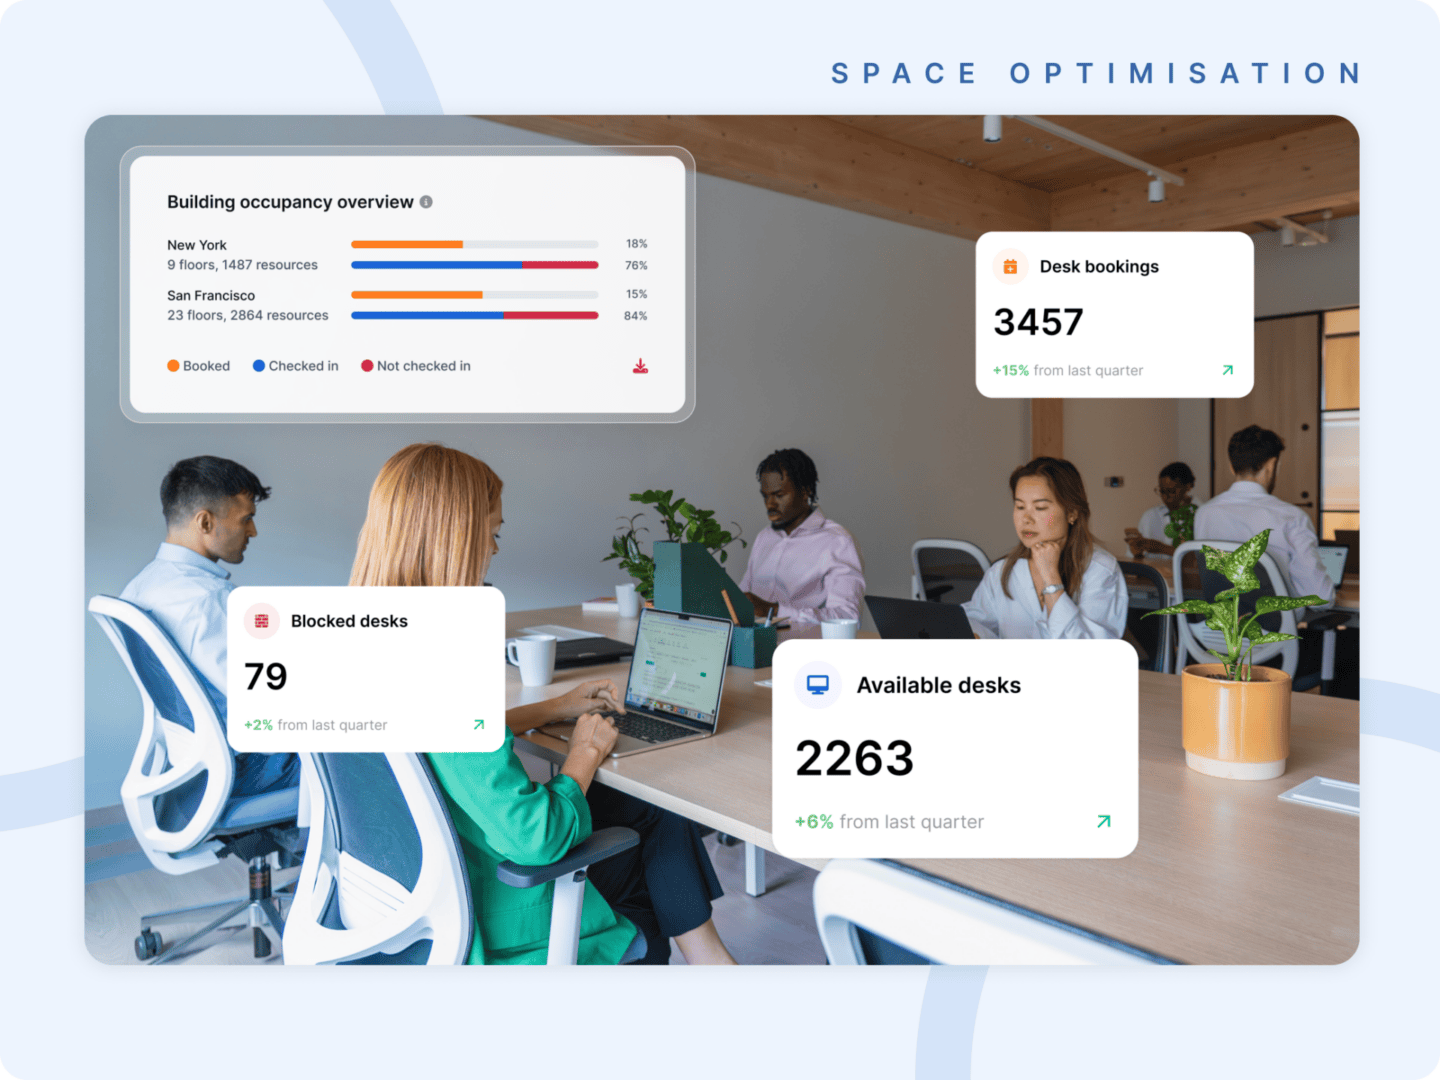
Office occupancy rate is the percentage of available capacity in use at a given time. It is a useful headline figure, but reported as a single average it misleads, flattening the gap between a packed Tuesday and an empty Friday. Read it alongside peak and average, never on its own.
Peak vs. Average Utilization
Averages hide what matters most for capacity. An office running at 45 percent on average may still hit 90 percent every Wednesday, and it is the peak that decides whether people can find a desk. Planning to the average builds in failure on the busiest days.
Desk and Room Utilization
Desks and meeting rooms need measuring separately, because they rarely move together. Desks often sit under capacity while rooms are chronically overbooked, a mismatch that a single combined figure hides entirely.
Capacity Variance Across Locations
For multi-site organizations, the gap between how hard each location works is a decision in itself. Wide variance signals where space can be consolidated and where demand should shift, and it is often the clearest early indicator of a right-sizing opportunity.
Booked vs. Used
The gap between space booked and space actually used is the reliability check most reporting misses. Rooms reserved but never used, or desks booked and left empty, inflate apparent demand and lead to overbuilding. Because it reflects behavior rather than intent, booked-versus-used is the strongest signal of real demand.
From Office Utilization Data to Occupancy Planning
Measurement only matters if it changes a decision. Occupancy planning is where that happens: the strategic discipline of aligning space to actual demand patterns over time, using utilization data to decide where to allocate space, where to consolidate, and where to redesign.
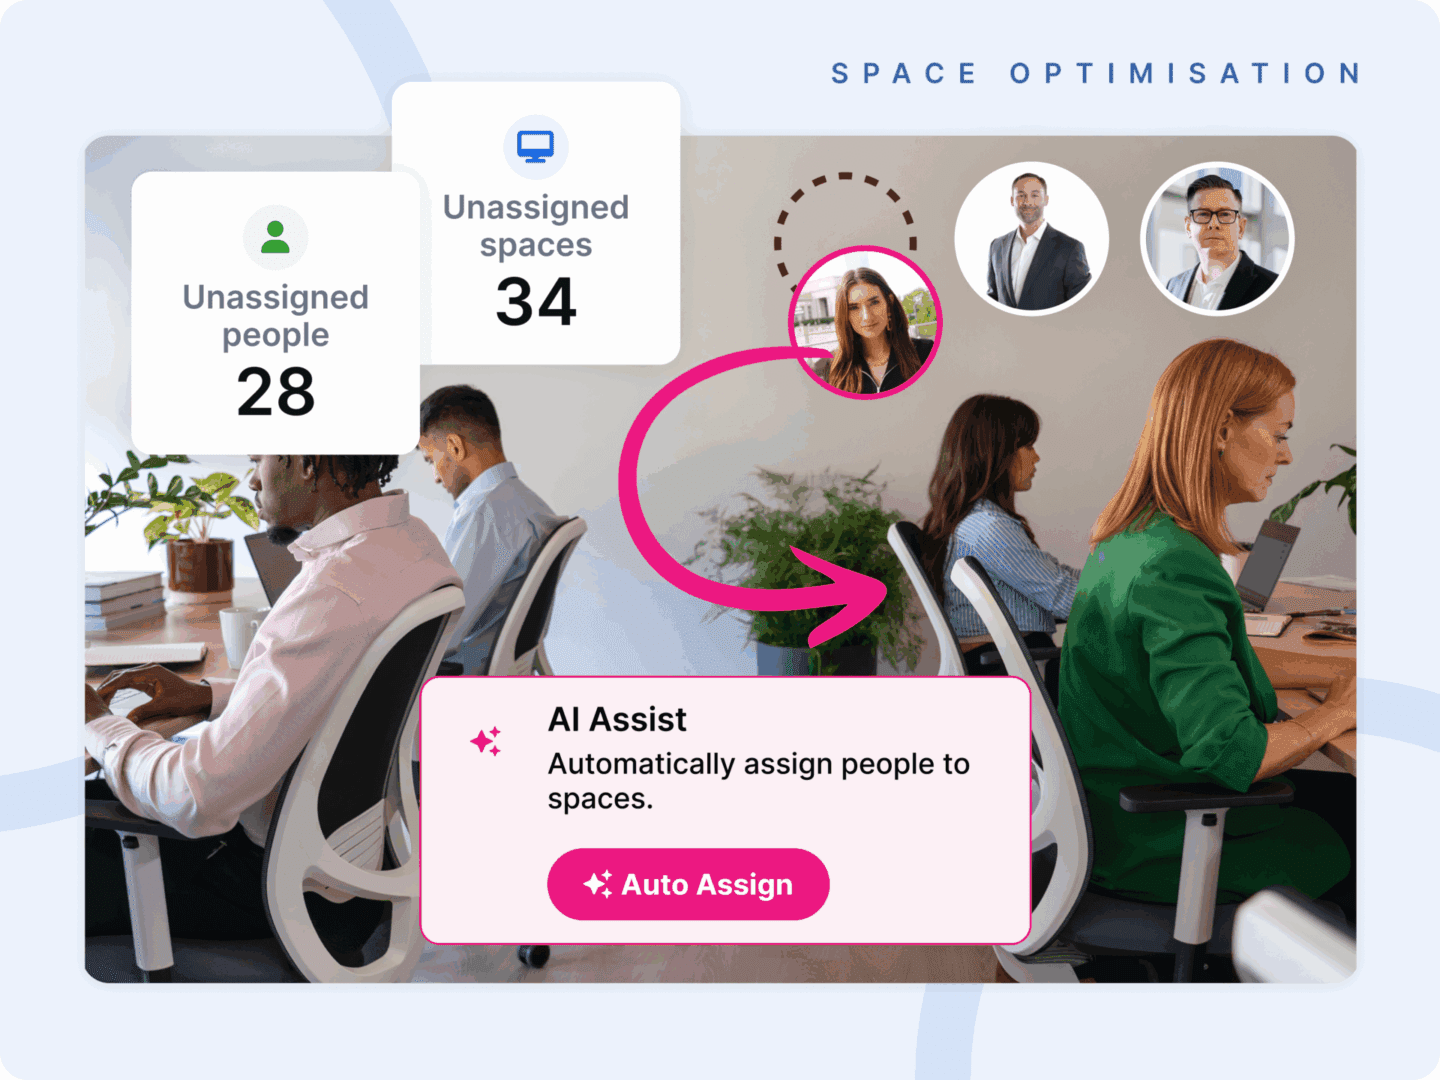
It helps to separate three terms that often get used interchangeably. Space planning is the physical design of a given layout. Occupancy management is the day-to-day administration of who sits where. Occupancy planning sits above both, as the ongoing practice of matching the portfolio to real and anticipated demand. That is the layer where utilization data earns its keep, turning a pile of measurements into office space optimization: less wasted space, better-matched capacity, and a footprint that reflects how the organization actually works. Those decisions split into two directions, the floor plan in front of a single team and the portfolio across the whole business, and utilization data drives both.
How Does Office Space Utilization Data Inform Floor Plan Design
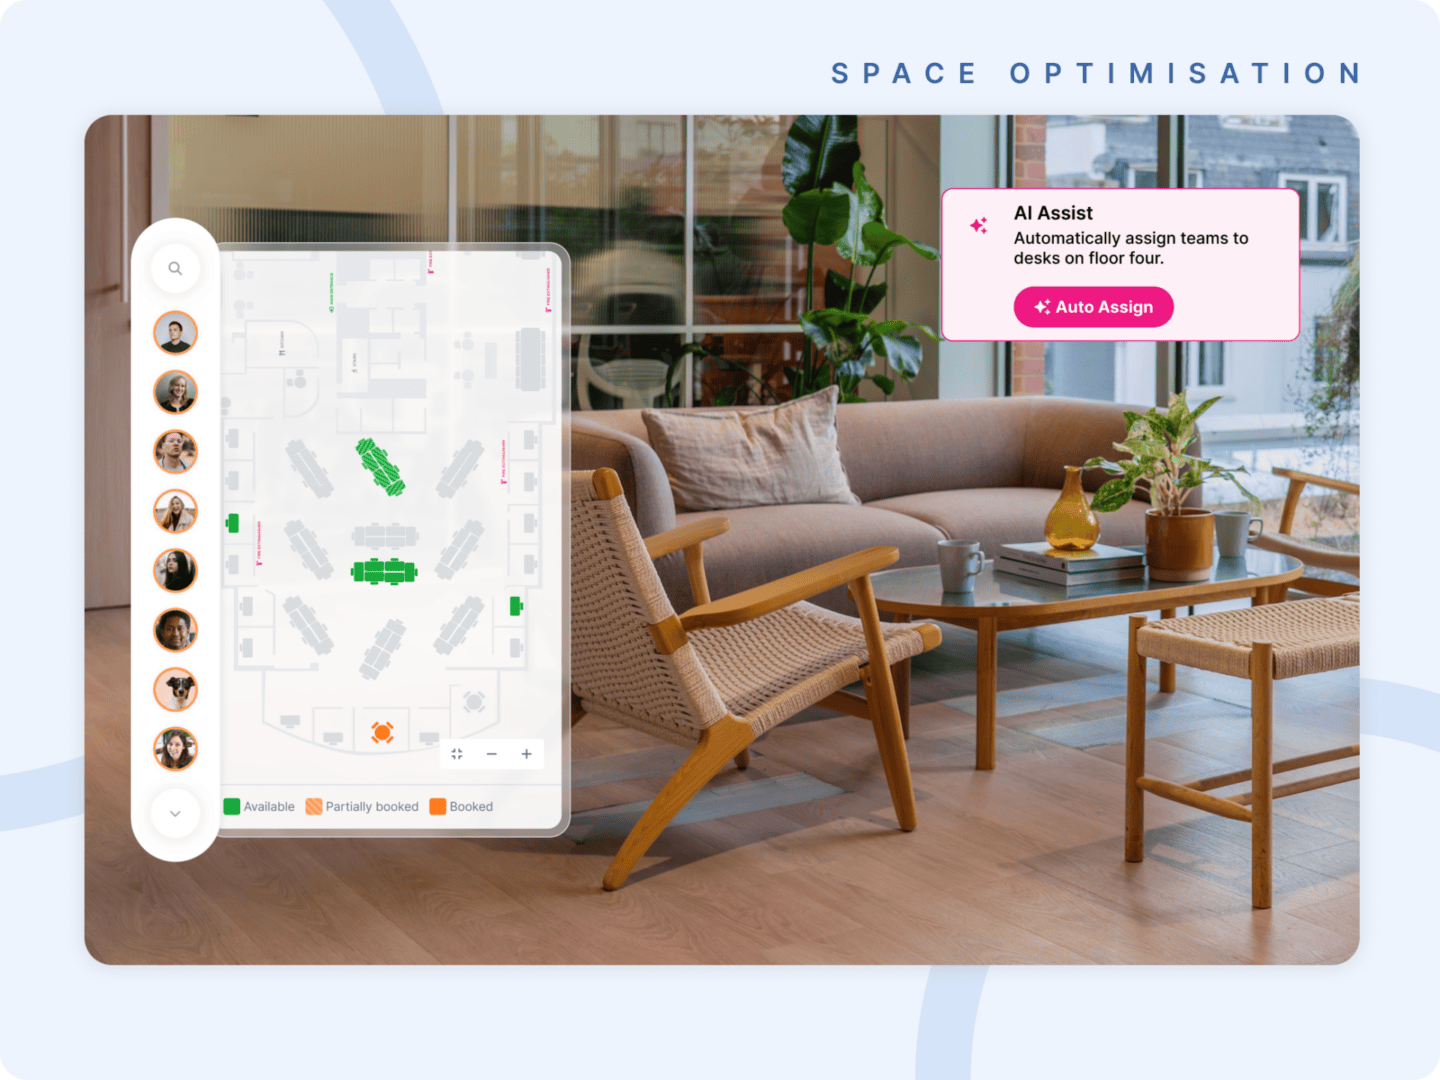
Office space utilization data informs floor plan design by replacing assumptions about how teams work with evidence of how they actually do. Instead of drawing a layout around an org chart, planners can shape it around observed demand, which changes several decisions at once.
Neighborhood demand patterns show which teams genuinely cluster and which have been placed together out of habit, guiding where to co-locate and where to separate. The collaboration-to-focus ratio, the balance between open collaborative space and quieter focus space, can be set against real behavior rather than a rule of thumb, so a team that skews heavily toward focused work is not handed a floor built for collaboration, or the reverse. Meeting room sizing follows actual booking patterns, favoring the small huddle rooms that get used over the large conference rooms that sit empty. And each team is right-sized against its actual attendance rather than its nominal headcount, since a team of 100 at 55 percent attendance does not need 100 desks.
The practical obstacle is speed. Most teams cannot iterate on floor plans fast enough, so a plan is often stale by the time it is approved, overtaken by a reorganization or a policy change. Designs that can be re-optimized as the data shifts, then locked once agreed, are what keep a floor plan matched to reality rather than to the moment it was drawn.
What Are Common Office Space Utilization Mistakes to Avoid
The most common office space utilization mistakes come from treating utilization as a report to be filed rather than intelligence to be acted on. The measurement happens, and then nothing changes.
A few recur. Teams run utilization as a one-time audit rather than ongoing intelligence, so the picture is out of date within a quarter. They report peak load when leadership needs the average, or the average when the decision hinges on peak. They build plans on attendance assumptions instead of actual behavior. They optimize a floor plan but fail to communicate or execute the change, so the design never reaches the building. And they confuse operational reporting, which describes what happened, with strategic decision intelligence, which informs what to do next. Each of these is avoidable, and most are quietly common.
How to Connect Office Space Utilization to Broader Workplace Decisions
Office space utilization connects to broader workplace decisions by serving as the evidence base beneath them. Better floor plans are the local benefit. The larger value is portfolio-level, where the same data underwrites decisions worth far more than any single layout.
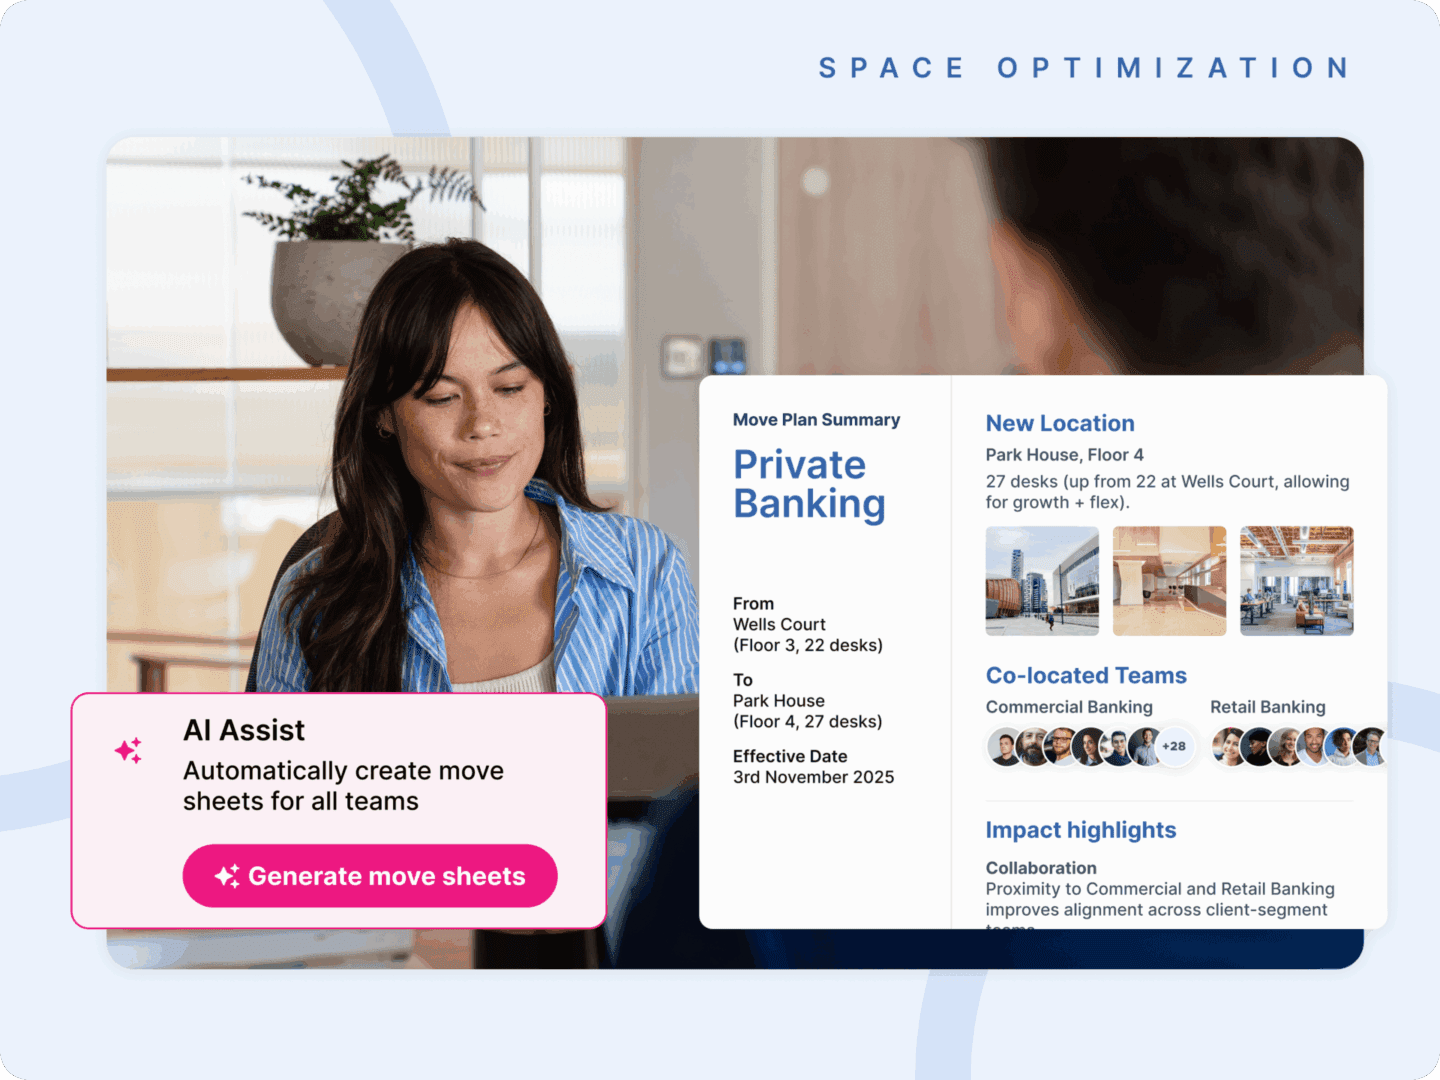
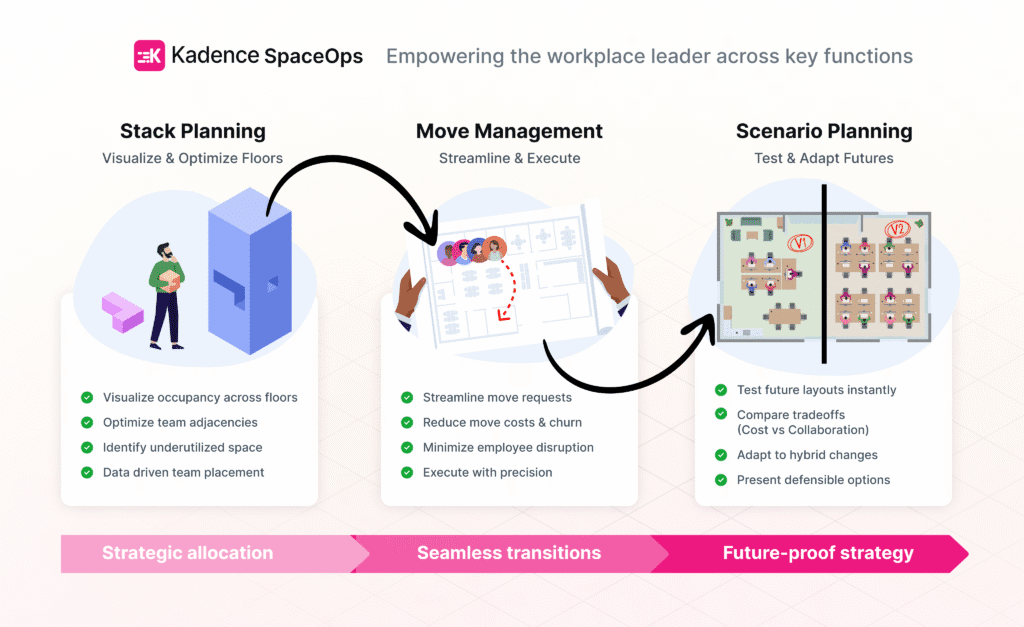
Utilization data is what makes lease renewal and consolidation modeling defensible, showing how much space can be released without straining peak demand. Across a multi-site portfolio, it drives right-sizing by revealing where capacity is genuinely needed and where it is not. It feeds workplace scenario planning for headcount changes and policy shifts, and it informs move and restack execution so that change follows real demand rather than assumption. For finance and corporate real estate leaders, this is the difference between defending a number and guessing at one.
How Kadence SpaceOps Supports Office Space Utilization and Occupancy Planning
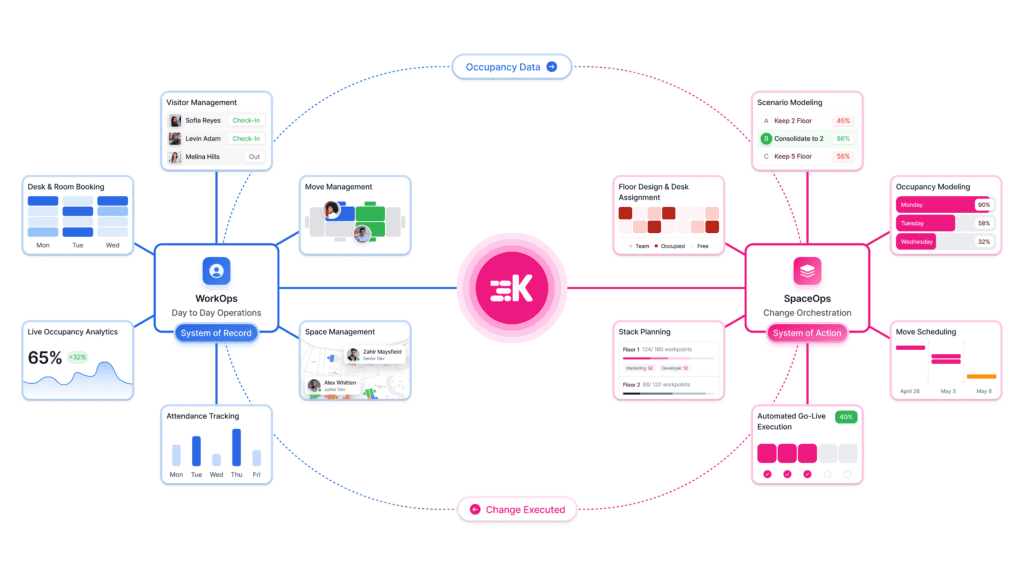
Utilization data is only as valuable as the decisions it informs. Kadence SpaceOps closes the gap between the two, combining live behavioral data, AI-powered stack and floor plan optimization, scenario modeling, and execution in a single loop, so a utilization insight can become an approved, implemented change without leaving the platform. One Kadence customer, Wavex, used this approach to reach a fourfold improvement in space efficiency. For how utilization fits into the wider discipline, see our guide to office space planning [HUB URL — pending].
To see how SpaceOps turns utilization data into decisions, book a demo with our workplace operations experts. If you are still scoping the opportunity, our ROI calculator estimates what optimized space could return.
FAQs about Office Space Utilization
What is a good office utilization rate? There is no universal benchmark, but a peak utilization figure commonly cited as healthy sits in the region of 60 to 80 percent, leaving headroom for the busiest days. The right target depends on attendance patterns and how much flexibility the space is designed to absorb.
How do you calculate office occupancy?
Divide the number of people or spaces in use by the total available capacity, then express it as a percentage. Measured over time rather than at a single moment, it becomes a utilization pattern rather than a one-off snapshot.
How can you improve office space utilization?
Measure actual behavior across desks and rooms, right-size space to real demand, adjust the collaboration-to-focus mix, and re-plan as attendance changes. The gains come from acting on the data, not just collecting it.
What is the difference between occupancy planning and space planning?
Space planning is the design of a specific layout. Occupancy planning is the ongoing discipline of matching the portfolio to real and anticipated demand over time. Space planning produces a floor plan; occupancy planning decides what that floor plan should achieve.